Nine-Month New Home Warranty Report:
Claims, accruals, and reserves continue to see a pattern of steady growth, despite many economists' predictions of an impending recession. Accruals per home sold continue to increase, though inflation and rising home prices mean that the accrual rate per dollar of revenue has decreased.
New home sales are often regarded as a leading economic indicator. Right now, there is a lot of difference of opinion about where the United States' economy is heading, with many economists pointing to a number of different metrics as harbingers of recession. Of course, there is still the minority who assert that this is just a slowing of growth, or perhaps even that the worst of the downturn is already behind us.
Certainly, we saw a short downturn in new home sales during the height of lockdown, though growth quickly resumed in this industry. With data as recent as the third quarter of 2022, we have seen this growth pattern continue in terms of the key warranty metrics of this industry, though, of course, some of this can be explained by rising inflation rates increasing the cost of everything.
Since early 2003, we have collected warranty expense data from every publicly-traded single-family home builder listed on a U.S. stock exchange. From each of their annual reports and quarterly financial statements we gathered three essential warranty metrics: the amount of claims paid, the amount of accruals made, and the amount of warranty reserves held. Since 2022 fourth quarter reports are not yet available, we are looking at data as recent as September 2022.
We also gathered data on the amount of homebuilding revenue they reported (minus land sales and mortgage-lending income, if any), as well as the number of homes they sold. Using these data, we made two calculations regarding accruals: the percentage of home sales revenue set aside as warranty accruals (the accrual rate), and the dollar amount of accruals set aside per home sold (calculated by dividing the accrual total by the number of homes closed). So there are two accrual rates, one a percentage and the other a dollar amount.
Before we look at the data, let's briefly discuss the trends we've seen in the warranty metrics of the American new home builders in the past 20 years. In retrospect, an analysis of the warranty data shown in Figures 1, 2, and 3 shows that the industry saw its peak in late 2006, and the dip began as early as the first quarter of 2007, though the Great Recession did not truly begin until the end of that year. One would expect to see a similar beginning of a dip to indicate an upcoming recession, and this is not evident in our data.
Certainly, a big difference between 2007 and now is that last year saw uniquely high inflation rates, and the increase in the numbers could, perhaps, simply be explained by the fact that the price of everything has increased. Notably, as seen in Figure 4 below, the average accruals as a percentage of revenue have seen a bit of a decrease, though the dollar amount of accruals per homes sold has increased.
Of course, we here at Warranty Week do not have a crystal ball. However, this is a rare situation, where the country collectively holds its breath, with everyone from CEOs to your neighbor expecting a big dip any day now. We will point out that the most significant recessions were almost completely unexpected. It will be interesting to see what unfolds, how this is reflected in these companies' upcoming annual reports, and what happens in the next few quarters.
Warranty Claims Totals
Since 2022 fourth quarter and annual reports are generally not yet available, we are looking at our metrics quarterly in this report. In Figure 1, we see that warranty claims in the U.S.-based homebuilding industry have been on an upward trend since the second half of 2021.
Figure 1
Homebuilding Warranties
Claims Paid per Quarter by U.S.-based Builders
(in US$ millions, 2003-2022)
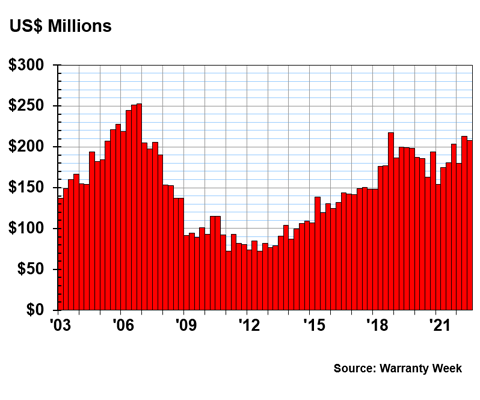
Indeed, claims paid in the beginning of 2022 were up 17% to $180 million compared to where they were in the beginning of 2021. The second quarter of 2022 saw the biggest increase, with home builders paying $213 million in claims, up 22% compared to the same quarter a year prior. The third quarter was also up 15% compared to the same period in 2021. In fact, industry claims have risen since the middle of 2021 in comparison to the figures from a year prior to each quarter.
In fact, there has been a visible reversal to the downward trend we reported in our September 23, 2021 New Home Warranty Report. Of course, it is likely that some of these claims made in the second half of 2021 and the first three quarters of 2022 were latent or delayed by the pandemic and lockdowns. Still, these are significant increases in claims activity in this industry. At least as seen in Figure 1, perhaps the worst of the pandemic downturn is behind the new home builders.
Warranty Accrual Totals
In Figure 2, we are looking at the amount of warranty accruals set aside by the new home builders that we track. By this measure, there was consistent growth in 2020, 2021, and the three quarters of 2022 for which we have data.
Note that there is a definite seasonal pattern to these data. Every year, accruals are the slowest in the first quarter, and the fourth quarter is always the busiest.
Figure 2
Homebuilding Warranties
Accruals Made per Quarter by U.S.-based Builders
(in US$ millions, 2003-2022)
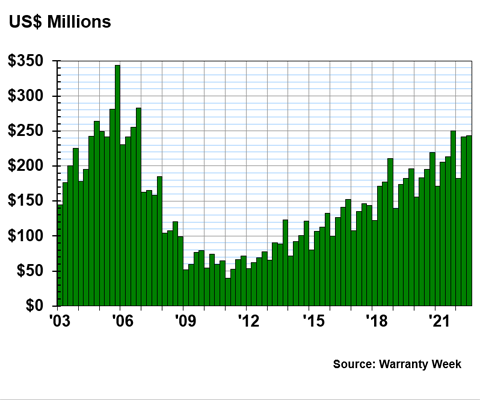
In 2022, accruals were up 7% in the winter, 18% in the spring, and 14% in the summer, compared to 2021. Furthermore, in 2021, accruals were up 10% in the winter, 12% in the spring, 9% in the summer, and 14% in the autumn, compared to 2020.
Converse to this growth in warranty accruals, the number of new homes sold in the first three quarters of 2022 were very consistent with the same figures from the year prior. New home sales have remained within three percent of the figures from the correlating quarter of 2021, with sales down -2.5% in the first quarter, down by -0.5% in the second quarter, and up just 2.5% in the third quarter. The first two quarters of 2021 had seen the most significant increase in new home closings since 2013, with growth rates over 20%.
Comparing the growth rates of warranty accruals versus number of new homes closed, we see that these increases in accruals in 2022 are, in part, making up for these significant increases in the first half of 2021, where the growth in sales exceeded the growth in accruals. This plateau in new homes sales has perhaps allowed the new home builders to catch up with their warranty accruals, though as we see in Figure 3, warranty reserves do continue to increase overall in this industry.
Warranty Reserve Balances
In Figure 3, we are tracking the cumulative balance in the warranty reserve funds of the homebuilders at the end of each quarter. The balance in these reserve funds continues to climb despite the trend of increasing claims shown in Figure 1, due to the increase in accruals shown in Figure 2.
Figure 3
Homebuilding Warranties
Reserves Held per Quarter by U.S.-based Builders
(in US$ millions, 2003-2022)
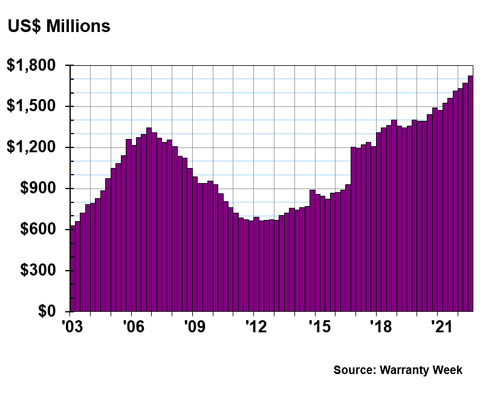
In 2016, reserves exceeded $1 billion for the first time since 2008, and have remained above this threshold since then. In fact, every quarter since the beginning of 2021 has been a record-breaking high for warranty reserves in this industry. In the third quarter of 2022, reserves exceeded $1.7 billion, an 11% increase compared to the year prior. Total warranty reserves in this industry have seen consistent growth over the past two years.
Warranty Accrual Rates
In this industry, as with passenger cars, the top warranty providers report both unit sales and revenue totals. Since the units are relatively similar (though they run the gamut from starter homes to luxury mini-mansions), we can readily calculate and compare the amounts the builders set aside in accruals per unit sold as well as accruals as a percentage of sales revenue. In Figure 4, we do both.
Figure 4
Homebuilding Warranties
Average Warranty Accrual Rates
($ per home and % of revenue, 2003-2022)
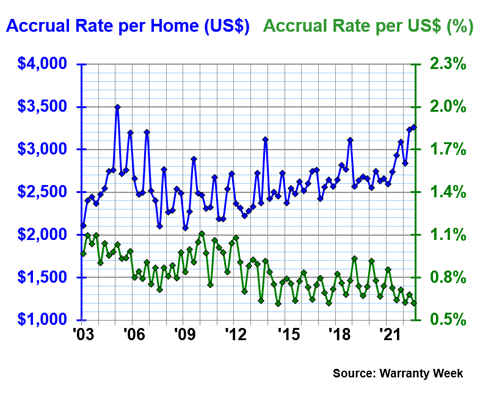
While the accrual rate per dollar of revenue continues to oscillate in that seasonal pattern, the accrual rate per home sold has seen fairly consistent growth over the past two years. We see a divergence between these two metrics, as accruals per dollar of revenue trends downward while accruals per home sold has trended up. This indicates that the average home price has increased, which certainly matches up with the anecdotal evidence of the notable inflation that the United States has experienced in the past two years. Certainly, the soaring home prices noted during even the early days of the pandemic were a harbinger of the inflation to come to the economy as a whole.
In the last seven quarters, since the beginning of 2021, the accrual rate per dollar of revenue has ranged from 0.85% to 0.62%, which averages out to 0.69%. The accrual rate per home sold, meanwhile, ranged from $2,596 to $3,260, averaging out to $2,953. The standard deviations, which are a measure of the volatility of the measurements, have been 0.08% and $232 over that time period.
Over the past 79 quarters, the accrual rate per dollar of revenue averages out to 0.84%, with a standard deviation of 0.14%. The long-term accrual rate per home sold averages out to $2,596, with a standard deviation of $283.
Annual Rates for Specific Builders
In the following five charts, we are going to detail the accrual rates per home sold for 20 of the builders we track. Back in Figure 4, we saw that this average for the industry as a whole had a tendency to occasionally spike, especially from 2005 to 2009, 2013, 2018, and again recently in 2021 and 2022. Now we shall see why.
In each of these charts, there is a company that mostly flat-lines, and another that oscillates wildly. With this metric, unlike a heart monitor, flat lines are good, and spikes or sine waves are bad, indicating volatility, and perhaps a lack of ability to accurately predict warranty liabilities.
Figure 5
Homebuilding Warranties
Warranty Accruals Made per Unit Sold
(in US Dollars, 2003-2022)
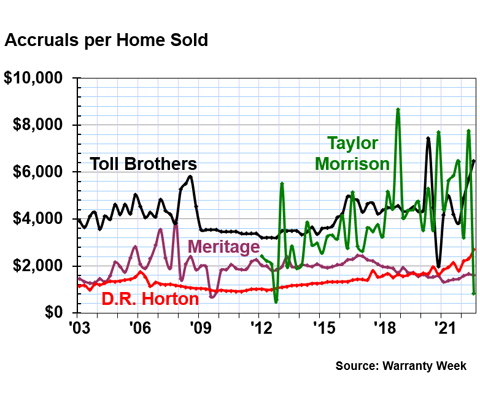
Since 2003, Toll Brothers Inc. has averaged an accrual of $4,142 per home sold, considerably higher than the industry average of $2,596. But so are the selling prices of its luxury homes; presumably, the level of customization for units like this, compared to a modular home for example, comes into play here.
In future news, Toll Brothers made a $39.4 million additional special accrual during the year ended October 31, 2022, noting that they expect $29 million of this number reimbursed by their insurance company. We expect to see this reflected in our next warranty report on this industry.
Taylor Morrison Home Corp., at $3,841, is also above the industry average, and also building units at the more luxurious end of the spectrum of new homes closed. However, they also have a very high standard deviation, $1,732, reflecting extreme volatility and oscillation in their accruals.
On the other hand, Meritage Homes Corp., at $1,922, is one of the builders whose accrual rate per home sold is nearly always below the long-term industry average. D.R. Horton Inc., the largest home builder in the country, is another one of the most consistent companies we track in this industry, with an average of $1,350 and a standard deviation of just $355.
In Figure 6, the lines get a bit more chaotic, with PulteGroup Inc. ending up above the average, and KB Home, M.D.C. Holdings Inc., and Century Communities Inc. ending up below average.
Figure 6
Homebuilding Warranties
Warranty Accruals Made per Unit Sold
(in US Dollars, 2003-2022)
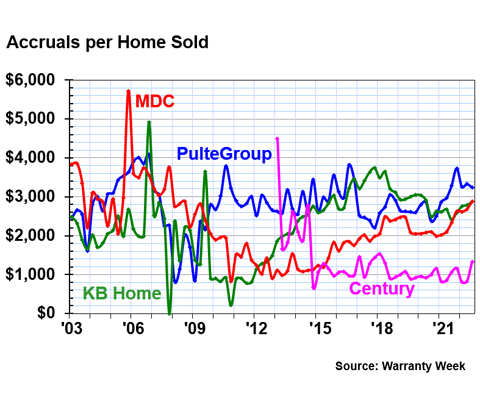
Over the long term, Pulte is a bit above average at $2,823 per home sold, while KB Home is a bit below average at $2,294. MDC is at $2,237, and Century is close to the bottom at $1,308 per home sold. Overall, all four of these companies have managed to relatively smooth out their volatility compared to their accruals in the late 2000s and early 2010s.
Figure 7 contains three of the four most volatile companies we track: Beazer Homes USA Inc., Hovanian Enterprises Inc., and NVR Inc. The fourth company in this chart, the New Home Company Inc., was previously the most volatile of those in this report, with both the highest average and standard deviation, and was in fact acquired by the private equity firm Apollo Global Management in September 2021.
Figure 7
Homebuilding Warranties
Warranty Accruals Made per Unit Sold
(in US Dollars, 2003-2022)
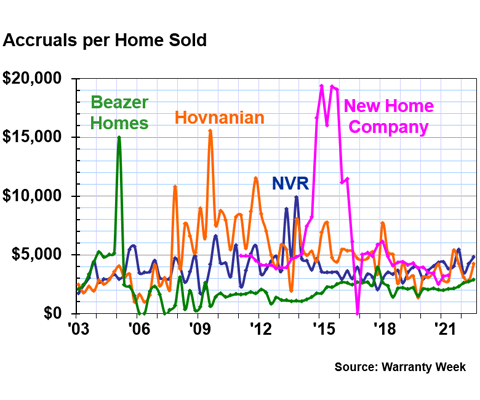
Of the three companies still in business for themselves and reporting their warranty data, Hovanian had the highest average of $4,875. Since New Home Co.'s acquisition, Hovanian is now the most volatile of the companies we track in this industry, with a standard deviation of $2,609.
Beazer Homes had a big spike in accruals back in 2005, but has settled into a more predictable pattern in the past decade. Its average accruals per unit sold is actually below the industry average, at $2,193. NVR also saw a more recent oscillation pattern, but its line has flattened out in recent years, with an overall average of $3,879.
In Figure 8, we're looking at two continuing operations and two builders that no longer report their warranty expenses. Shea Homes LP was never a public company -- it briefly reported its finances because it sold bonds that required it to do so. When those bonds were redeemed, it stopped reporting. And then William Lyon Homes was acquired by Taylor Morrison in February 2020, so it delivered neither its 2019 annual report nor any separate 2020 financial statements.
Figure 8
Homebuilding Warranties
Warranty Accruals Made per Unit Sold
(in US Dollars, 2003-2022)
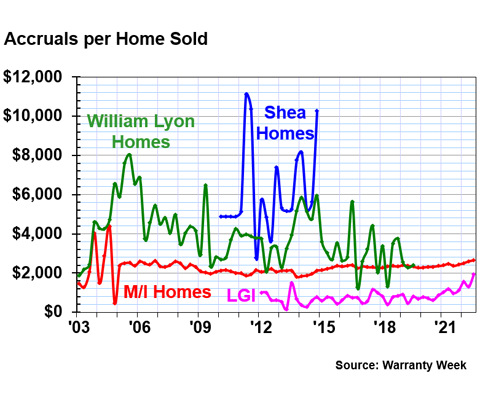
The other two companies, M/I Homes Inc. and LGI Homes Inc., join D.R. Horton (Figure 5) as the top three least volatile companies in this industry. M/I Homes is perhaps the most consistent of the companies we track in this industry, and though its accruals have sloped slightly upwards in the past few quarters, it stays close to its long-term average of $2,264. LGI Homes continues to hold the distinction of being the only company to keep its accruals below $1,000 per home sold, averaging just $796, with the lowest standard deviation as well.
Finally, in Figure 9 we have what looks like four companies but is really just the family tree of one company. Standard Pacific Homes and the Ryland Group Inc. merged in 2015 and changed their name to CalAtlantic Group Inc. And then in early 2018, Lennar Corp. acquired CalAtlantic.
Figure 9
Homebuilding Warranties
Warranty Accruals Made per Unit Sold
(in US Dollars, 2003-2022)

Lennar is one of the largest home builders in the country, second only to D.R. Horton in the first three quarters of 2022 in terms of number of homes closed. With an average of $3,306, Lennar is above the industry average of accruals per home sold, and this figure has been increasing since early 2021. Interestingly, Lennar also donates $1,000 to charity for every home it sells.
As unstable as its acquisitions were before they were purchased, they apparently have not imported their chaos to Lennar's warranty metrics. No, it's not quite as consistent as D.R. Horton, Meritage, or M/I Homes, but certainly it is much less volatile than Hovanian, Beazer Homes, Taylor Morrison, or any of the companies we track that are no longer independently operated businesses.