Auto Warranties:
While the Big Three sold two-thirds of the vehicles purchased in the U.S. in 2003, they settled three-quarters of the warranty claims. On average, Detroit pays twice as much in claims per vehicle as Toyota and Honda. But that's not the only quality gap. Recent research finds striking gaps between perceived and actual quality levels.
American automobile manufacturers have both a warranty- and a quality-related problem. Not only do their warranty claims average more than twice as much as their top Japanese competitors, but their overall quality images are generally lower than they should be.
In the year just ended, automotive experts say roughly 16.68 million new vehicles were sold in the U.S. Warranty Week projects domestic U.S. auto warranty claims of roughly $7.9 billion, meaning an average of just under $476 in claims per vehicle sold in 2003.
Using the warranty claims and accrual rates observed earlier in 2003 for each manufacturer, and applying those rates across a full year's sales, Warranty Week expects General Motors Corp. to spend roughly $537 on claims per vehicle. Ford Motor Co. will spend around $541. DaimlerChrysler AG will spend around $628. Their weighted average will be around $560 per vehicle across all their brands and product lines.
Japanese imports, meanwhile, will average only $226 per vehicle in warranty claims, with Toyota/Lexus at $233 and Honda/Acura at $216 per vehicle sold in the U.S. Deservedly, these automakers are perceived to be manufacturers of high-quality vehicles that experience relatively few warranty claims. But not everything they make is top-rated, and not everything made in Detroit is at the bottom of the rankings. What's surprising is how wide the gap is between actual and perceived quality.
U.S. Auto Sales in 2003
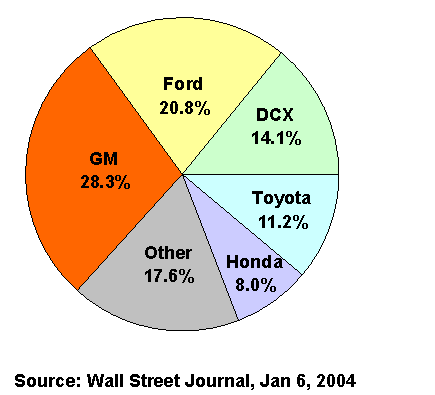
First, let's take a look at projected vehicle sales in the U.S. The Wall Street Journal ran its initial 2003 totals on Jan. 6, counting 16.68 million new vehicles sold during the year -- a slight decline from 2002 volumes.
The Journal projected GM at 4.72 million vehicles sold (28.3%) and Ford at 3.47 million vehicles sold (20.8%). In the past week, GM has updated its U.S. sales number to be 4.757 million, and Ford has claimed 20.5% of a 17-million-unit U.S. market (3.485 million units). But we'll leave those updates aside for a moment to keep the pie chart whole. We'll also mention that worldwide, Toyota claims to have sold 6.78 million vehicles, slightly more than Ford's 6.72 million worldwide total, although Ford remains ahead in the U.S. market.
Also in the U.S. market, DaimlerChrysler was estimated at 2.35 million units (14.1%); Toyota Motor Corp. was projected at 1.87 million units (11.2%); and Honda Motor Co. Ltd. was estimated at 1.3 million units (8%). All others were projected at 2.9 million units (17.6%), but keep in mind that the Saab brand was included in GM's total while Jaguar, Volvo and Land Rover were included in Ford's.
U.S. Cars & Light Trucks
Vehicles Sold in 2003
Total = 16.68 m vehicles

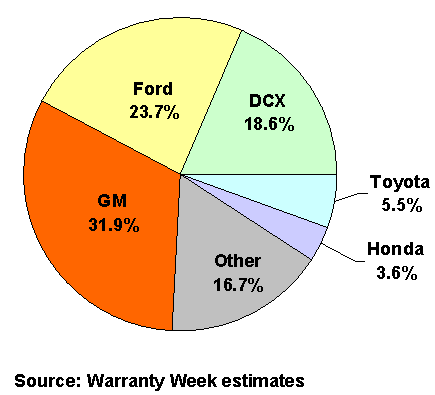
The Big Three's total share of the pie was 63.2%, or roughly two-thirds of the total U.S. market. Their "share" of the warranty "market," however, was probably closer to three-quarters, as the chart below illustrates. Warranty Week expects GM to report roughly $4.6 billion in warranty claims for 2003, of which approximately 55% will be U.S.-based. Ford will come in around $3.6 billion worldwide, of which around 52% will be U.S.-based. DaimlerChrysler, assuming $45 billion in U.S. auto revenue and a continuance of its recent 3.3% warranty claims rate, will see roughly $1.5 billion in U.S. warranty claims for 2003.
Together, the Big Three will probably register around $5.9 billion in U.S. warranty claims, or just under 75% of a $7.9 billion total. Warranty Week expects Toyota to continue its recently-seen 1.2% warranty claims rate, and expects Honda to continue to experience a 1.1% claims rate. Together, the pair are likely to have experienced warranty claims of roughly $723 million in 2003.
U.S. Cars & Light Trucks
Warranty Claims in 2003
Total = $7.9 billion

The pictures tell the story. GM, Ford, and DaimlerChrysler experience a disproportionately larger share of warranty claims than do Toyota and Honda. Unfortunately, importers such as BMW, Volkswagen, Porsche, Suzuki, Nissan, Hyundai, and Kia have made no warranty disclosures, so their sales and warranty claims totals must remain shrouded in the "other" category. However, their collective warranty claims totals are assumed to be roughly proportional to their sales totals.
The Quality Gap
As mentioned, the Big Three are averaging $560 in warranty claims for every vehicle sold in 2003, while Toyota and Honda average $226. But those are just the overall numbers, computed by dividing total warranty claims by number of vehicles sold. They say nothing about what to expect from a 2003 model year vehicle, nor do they make any comparisons with the past. And of course, they are averaged not only across multiple manufacturers, but also multiple nameplates per manufacturer.
What if there existed a list of all automobile makes and models sold in the U.S., with a column for number of vehicles sold per year and another for average warranty cost per vehicle? Relax, because there isn't such a list, and there won't be if reports made to the U.S. government under the TREAD Act remain non-public. But there is something awfully close in the form of the Initial Quality Survey published by J.D. Power and Associates. These rankings are tabulated based upon reports from millions of new vehicle owners, and come in the form of Power Circle ratings. Five Power Circles means a given vehicle is among the best. Four Power Circles mean a vehicle is better than most. Three Power Circles means a vehicle doesn't really stand out, and two Power Circles is what's assigned to the rest.
Of 206 vehicles from the 2003 model year that were rated by J.D. Power, 27 received five Power Circles for their overall quality, and 44 received four. An additional 71 got three circles, and 64 received two. While it might be no surprise to hear that 29 vehicles or 40% of the models ranked with 4 or 5 circles came from Toyota, Honda, or Nissan, what's notable is the makeup of the remaining 60%. Seven top-rated models cane from DaimlerChrysler; nine came from Ford; and 17 came from GM. That gives the Big Three a 46% "share" of the top-ranked models. Among the others were three models from Hyundai, two from BMW, and one each from Volkswagen, Audi, Subaru, and Porsche.
It's somewhat surprising to see the Mercury Sable or the Ford F-150 ranked at the top, alongside the Lexus ES 300 or the LS 430. What's even more surprising is to see the Chevrolet Malibu or the Buick Regal at the top of the list. But each of these models received five out of five Power Circles for overall quality.
What's equally surprising is to see which models received only two Power Circles: five Volkswagen models, four Kia models, and three each for Nissan, Subaru, and Suzuki. While it was no surprise to find numerous Big Three models at the bottom of the list, what was somewhat shocking were some of the nameplates: Mercedes (3), Jaguar (3), Land Rover (3), and Volvo (3). Aren't these supposed to be high-quality brands? Obviously, there is a gap between actual and perceived quality.
Measuring the Gap
Morgan Stanley equity analysts Stephen Girsky, Adam Jonas, and Noriaki Hirakata recently set out to quantify and measure this quality gap, in a January 13 newsletter entitled "Quality Is In the Eye of the Beholder." What they did was compare the numerical J.D. Power ratings to brand name perceptions tabulated by CNW Marketing/Research Inc. through its surveys of consumers by phone and mail. When one measure exceeded the other, the analysts calculated the percentage difference. The higher the percentage, the larger the gap between perception and reality.
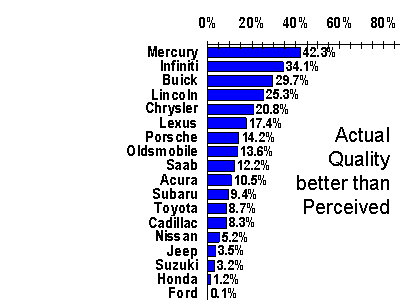
For 18 brands, the actual quality of the vehicles was found to be better than the perceived quality, by percentages ranging from 0.1% for Ford to 42.3% for Mercury. In other words, the quality image of these brands is perceived to be worse than it actually is, or to put it in a more positive light, actual quality is higher than people believe.
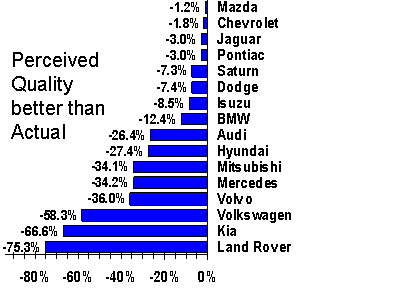
For an additional 16 brands, Morgan Stanley found that perceived quality was higher than actual. This list ranges from the -1.2% for Mazda to the -75.3% calculated for Land Rover. For these brands, people perceive quality to be better than it actually turns out to be. Actual quality is lower than people believe.
The Quality Gap
Perceived vs. Actual Quality


Source: Morgan Stanley, JD Power & CNW
Acura, Lexus, and Infiniti, the luxury nameplates of Honda, Toyota, and Nissan, respectively, are among the brands for whom actual quality is higher than perceived. What does this mean? Consumers rate the brands somewhat lower in terms of perceptions than they do in terms of actual experience. But it's a bigger gap for Infiniti (34.1%) than for either Lexus (17.4%) or Acura (10.5%). All three are rated highly in terms of both perceived and actual quality, but the gap suggests that actual quality is even higher than is perceived.
The surprise is how under-appreciated Detroit-based brands such as Mercury, Buick, Lincoln, Chrysler, and Olds turn out to be. For each of these brands, actual quality turned out to be much higher than was popularly perceived. Products perceived to be of below-average quality turn out to be average or even above-average.
The shock, however, comes at the bottom of the chart, where the perceived quality of Land Rover, Kia, Volkswagen, Volvo, and Mercedes turns out to be vastly higher than their actual quality ratings. This is a triumph of image -- of brand name perceptions over reality. Products with images of high quality turn out to be only average. Products with images of average quality turn out to be way below average.
There's not much for the Big Three to celebrate, however, because they own or control 19 of these 34 brands. And while nine have better-than-perceived quality levels, 10 have inflated levels of perceived quality. For GM, the Buick, Olds and Cadillac brands have a positive quality gap, but the Chevrolet, Pontiac, and Saturn brands have a negative quality gap.
For Ford, the Mercury and Lincoln brands are in the positive range while all of its import and premium nameplates are in the negative range. The Ford blue oval brand, it turns out, suffers from almost no quality gap at all. Its perceived quality is almost exactly the same as its actual quality. Same goes for Mazda, of which Ford owns one-third. Perceived quality is only slightly higher than actual quality.
At DaimlerChrysler, the Jeep and Dodge brands are relatively closely matched in terms of perceived and actual quality. But the Chrysler brand is vastly under-appreciated, and the Mercedes brand is vastly over-appreciated. For every under-appreciated PT Cruiser (four Power Circles) there's a Mercedes E-Class (two Power Circles).
Perceptions Matter Most
Morgan Stanley found a higher correlation between perceived quality and changes in market share than between actual quality and changes in market share. In other words, when it comes time to sell cars, perceived quality is what matters most. In general, Detroit nameplates were under-appreciated and European nameplates were over-appreciated for their alleged quality. Japanese and Korean nameplates were somewhere in the middle.
Not only does this quality gap affect sales; it also affects price and incentive packages. Morgan Stanley found that the five brands with the lowest levels of incentives (Lexus, Land Rover, Acura, Honda, and Porsche) had higher perceived quality levels than the five brands with the highest levels of incentives (GM, Ford, Jaguar, Chrysler, and Isuzu). The difference in incentives amounted to more than $3,000 per vehicle.
Morgan Stanley also computed changes in actual and perceived quality over the period 1997 to 2003. For seven brands, led by Land Rover, Saab, and Jeep, actual quality was on the increase while perceived quality declined. For Audi, Mercedes, and Volvo, actual quality declined at a much faster pace than perceived quality.
The analysts suggest that there is a lag time between these changes and actual shifts in buying patterns. They also suggest that quality changes in the positive direction for either perceived or actual quality have a greater effect than changes in the negative direction. In addition, they suggest that consumers react faster to sharp changes in quality than to moderate changes.
Art Spinella, president of CNW Marketing/Research, more or less confirmed what the Morgan Stanley analysts suggested. Perceptions matter more than reality, and those for whom perceptions are vastly better than actuals are lucky to be there, because perceptions will take years to change -- years that a manufacturer can spend fixing up actual quality.
"It's a very logical comparison to make," Spinella said, "because perceptions are about 80% of reality when it comes to the auto industry. If someone thinks a particular car's quality is extremely good, and they buy one and it winds up being only mediocre, the chances of them repeating that purchase will diminish far more dramatically than if they thought the quality was only fair, they bought it and it was only fair, and they think they got what they paid for."
In other words, only time will allow Mercury's perception to catch up to its actual quality, while lots of disappointed Land Rover owners will soon be spreading the bad news by word of mouth. Ford's blue oval brand, meanwhile, would have to get radically better or radically worse for opinions to shift by much. Right now, most people expect three Power Circles and for the most part that's what they get.
Spinella said that if he had the auto executives in the room, he'd tell them to continue to quietly improve the actual quality of their vehicles, whether the actuals are ahead or behind perceptions. If quality is ahead, eventually perceptions will catch up. If it's behind, hurry up before consumers realize how big the gap is. It's far simpler to change the actuals than the perceptions, which Spinella said can take upwards of five years to shift appreciably.
"You cannot convince people through advertising that the quality has improved," he said. "That flies in the face of what all the marketing people would like to tell their bosses. The reality is that there's only one indicator that people accept as being a true answer to whether a product is high quality or not, and that is somebody telling them it is, or living through it."
The Yugo Effect
Spinella said that five years ago when he mentioned a falloff in Volkswagen's quality, nobody believed him. Now, the perception is catching up to the reality. In CNW's latest study, Lexus outranked Mercedes in perception terms for the first time ever, after leading in actual quality for several years. The quality perception of the Chevrolet Malibu is finally beginning to match its actual quality improvements, he said, years after the fact. And he noted that it took Hyundai five years to turn around the actual quality of its vehicles, and then seven more years to turn around the perception.
Long warranties of course helped make that shift possible. Spinella noted, however, that while long warranties overcome consumer worries about paying for breakdowns, they don't do much to allay fears of being stranded. "People despise the rattles," he said. "But the thing that would keep them from buying a vehicle is not that they're going to get killed in it because it's too small. The biggest fear is that it's going to break down in the middle of nowhere and I'm not going to be able to get it fixed."


