Product Warranty Spending:
With most of the third quarter financial reports behind us, it's looking like warranty spending is up only slightly in 2006. But the changes at some of the top warranty providers are very large, in both dollar and percentage terms.
American manufacturers have so far in 2006 reported $20.721 billion in warranty claims, up a slim 1.1% from the $20.494 billion recorded during the first nine months of 2005. Paradoxically, their warranty accruals are actually down 3.6%, from $21.352 billion put aside during the first three quarters of 2005 to $20.589 billion put aside by September 30, 2006.
One reason may be the fact that a few very large manufacturers are seeing a diminishing need for funds to pay future warranty claims, because their products aren't failing as often and/or they aren't costing as much to repair. For instance, General Motors Corp., which paid out more than $3.5 billion in warranty claims during the first nine months of 2005, has paid out $238 million less so far this year. Perhaps in anticipation of further warranty contractions in the future, it has cut its accruals from $4 billion to $3.5 billion. That right there accounts for 60% of the total decrease.
Dollars and Percent
There are two primary ways to measure warranty: dollars and percentages. While the dollar figures are necessary and interesting, they're so heavily weighted by the machinations of a few manufacturers such as GM, Ford, HP, IBM, and Dell that everything else is eclipsed. Warranty Week also calculates percentages for claims and accruals as a fraction of product sales, and this allows for more meaningful comparisons among the 800 or so companies that report their warranty expenditures in their SEC Form 10-K and 10-Q financial statements.
We've been collecting this data for 15 quarters now, which means we now have something like 12,000 measurements of warranty claims and accruals rates over a period of just under four years. That data has been packaged for sale at www.warrantyweek.com/fasb/, but of course it's available for free to anyone who has the patience to look through 12,000 financial statements.
Every year, we tally it all up and publish some statistics about specific industries and overall averages. Every quarter, we usually take a quick look at the top 100 warranty providers, as measured by the amounts they pay in claims.
The full list of the largest warranty providers is available at the top of the www.warrantyweek.com home page. In the charts that follow, we've highlighted some of the top 100 companies with the highest and lowest claims rates and spending totals, as well as some of the automotive and computer/electronics companies with the highest warranty outlays.
The Effect of Missing Reports
The top 100 warranty providers together account for over 90% of all warranty claims paid, so what they do has a significant impact on the overall averages. Indeed, a change in rates by just one major player such as GM, or the absence of just one major player such as Dell, has a noticeable impact on the numbers. This quarter, we're still missing reports from major players such as Apple Computer and Navistar, and now Dell and Delphi are also late with their filings. So the value of what follows is significantly diminished by their absence.
If we look instead at the rate at which warranty spending occurs, the weight of their absence lessens. For while the major warranty providers spend billions of dollars, as a percentage of their sales they rarely spend more than 4% or 5%. In fact, the average claims rate of all manufacturers has remained close to 1.7% for the past four years.
Individual claims rates vary widely. In this latest quarterly exercise, we found everything from the 0.01% claims rate reported by Alliant Techsystems Inc. to the 22% claims rate turned in by Vyyo Inc. But only 20 companies were over 5%, though almost 250 were below 1%.
Let's start with a look at ten of the top 100 companies that have seen their claims rates fall the most in the year between the end of September 2005 and 2006. As can be seen from the data below, double-digit declines were required to make the top ten. In fact, GM was number 11 on the list with a 15.05% decline, only marginally behind Cummins' 15.16% decline. Better luck next time.
Figure 1
Top 100 U.S.-based Warranty Providers:
Largest Decreases in Claims Rates,
Sept. 30, 2006 vs. Sept. 30, 2005
(in percent)
| Latest | Yr. Ago | vs. | |
| Claims | Claims | Year | |
| Company | Rate | Rate | Before |
| Applied Materials Inc. | 1.6% | 3.4% | -53% |
| Medtronic Inc. | 0.4% | 0.6% | -39% |
| Tyco International Ltd. | 0.3% | 0.4% | -35% |
| Novellus Systems Inc. | 4.7% | 6.7% | -30% |
| M.D.C. Holdings Inc. | 0.8% | 1.0% | -21% |
| Manitowoc Co. Inc. | 1.3% | 1.6% | -19% |
| Polaris Industries Inc. | 1.2% | 1.5% | -17% |
| Palm Inc. | 5.3% | 6.3% | -17% |
| Varian Medical Systems | 2.9% | 3.4% | -15% |
| Cummins Inc. | 2.6% | 3.0% | -15% |
Source: Warranty Week from SEC data
Of the top 100 warranty providers, 44 saw their claims rates fall in the year between Sept. 30, 2005 and Sept. 30, 2006. The claims rate, of course, is calculated by dividing product sales into claims paid. Therefore, the claims rate could fall if sales rise and claims paid remains the same.
At United Technologies, for instance, sales during the first three quarters of 2006 rose 12%, $22.549 billion to $25.169 billion. Claims paid over the same two periods went up very slightly, from $318 million to $319 million. Combined, the company's claims rate fell 10%, from 318/22,549 (1.4%) to 319/25,169 (1.3%).
Or, the percentage could fall if sales remained the same and claims paid fell. This is what happened at NCR. Sales during the first nine months of 2005 were $2.246 billion. Claims totaled $38 million. In 2006, sales were flat at $2.237 billion. But claims paid fell to $34 million. That small decrease in sales combined with an 11% fall in claims paid combined to produce a 10% decline in the claims rate, from 1.7% to 1.5%.
Sales vs. Claims
Usually, it's a little of both. of the 44 that saw their claims rate fall, 27 paid out more in sheer dollars, while 17 paid out less. But 40 saw sales increases of varying sizes, so in each case the percentage fell.
In contrast, 41 of the top 100 warranty providers saw their claims rates rise. Changes in sales was a factor, but the overwhelming cause was a rise in dollars paid out in claims. While 25 saw sales rise and 16 saw sales fall, fully 35 saw the dollar amounts they paid out in claims rise, while only six paid out less in 2006 than they did in 2005.
Some of the claims rate increases were positively frightening in their magnitude. Visteon, for instance, saw its claims rate more than triple, from 0.2% at the end of September 2005 to 0.6% at the end of September 2006. Seagate more than doubled, and Johnson Controls almost doubled. In fact, the gains of the rest of the top ten were so large that Coachmen Industries' 39% gain and Jarden's 37% increase weren't even big enough to make the list:
Figure 2
Top 100 U.S.-based Warranty Providers:
Largest Increases in Claims Rates,
Sept. 30, 2006 vs. Sept. 30, 2005
(in percent)
| Latest | Yr. Ago | vs. | |
| Claims | Claims | Year | |
| Company | Rate | Rate | Before |
| Visteon Corp. | 0.6% | 0.2% | +218% |
| Seagate Technology | 2.6% | 1.1% | +127% |
| Johnson Controls Inc. | 0.4% | 0.2% | +98% |
| American Power Conversion | 2.4% | 1.2% | +92% |
| Lucent Technologies Inc. | 1.9% | 1.2% | +58% |
| Dana Corp. | 0.7% | 0.5% | +52% |
| Briggs & Stratton Corp. | 2.8% | 1.8% | +51% |
| Thermo Fisher Scientific | 1.3% | 0.9% | +44% |
| Fleetwood Enterprises | 4.9% | 3.4% | +42% |
| Harley-Davidson Inc. | 1.1% | 0.8% | +40% |
Source: Warranty Week from SEC data
Because some of the top 100 warranty providers report their warranty expenditures only once a year and because others are late filing their financial reports with the SEC, we had to look elsewhere for accurate claims rate data. The latest claims rates for Dell, Delphi, KB Home, and UTStarcom Inc. are taken from the end of the second quarter of 2006. The claims rate for Exide Technologies, and KLA-Tencor are from the end of the first quarter. Claims rates for Black & Decker, Eaton, General Electric, Goodyear Tire & Rubber, Illinois Tool Works, Motorola, and Textron are from the end of 2005. The claims rate for Navistar and Xerox are taken from Sept. 30, 2005. All 82 others are current as of Sept. 30, 2006.
Non-Compliance Continues
Six of those companies have missed at least one quarterly financial report filing in 2006, while nine others have decided they don't need to follow the accounting rules. Rather than adhering to the letter of FASB Interpretation No. 45's call to include warranty data in all annual and interim reports, eight companies have decided they need to report it only once a year: Black & Decker, Eaton, Exide Technologies, General Electric, Goodyear Tire & Rubber, Illinois Tool Works, Motorola, and Textron. In addition, Xerox has decided it no longer needs to comply with FIN 45 at all, either quarterly or annually, even though it last reported having $22 million in its warranty reserve fund.
Two of the top 100 companies filed their annual reports late in the year. Lucent Technologies officially merged with Alcatel on November 30. Though the company's fiscal year ended Sept. 30, its annual report wasn't filed until Dec. 14. Apple Computer filed its annual report on Dec. 29, after delays caused by accounting irregularities unrelated to warranty. Their figures have been incorporated retroactively into these totals since it was first published on Dec. 12.
Among the ten companies listed in Figure 3, Navistar hasn't filed a financial statement in a year. Delphi, which filed for bankruptcy protection in October 2005, is late with the filing of its third quarter 2006 report. Textron is one of the companies that has chosen to disclose its warranty spending only once a year, so it will be March 2007 before we know for sure what they've spent this year.
Figure 3
Top 10 Automotive Warranty Providers:
Total Claims Paid,
Nine Months 2006 vs. Nine Months 2005
(in $ Millions and Percent)
| 9 Mo. '06 | 9 Mo. '05 | Change | |
| Claims | Claims | in | |
| Company | $ Mil | $ Mil | Claims |
| General Motors Corp. | $3.304 | $3,542 | -6.7% |
| Ford Motor Co. | $3,071 | $3,032 | +1.3% |
| Caterpillar Inc. | $540 | $524 | +3.1% |
| Deere & Co. | $373 | $305 | +22% |
| Cummins Inc. | $215 | $218 | -1.4% |
| Navistar International | na | $199 | na |
| Paccar Inc. | $190 | $175 | +8.9% |
| Honeywell International | $153 | $148 | +3.4% |
| Delphi Corp. | na | $124 | na |
| Textron Inc. | na | $112 | na |
Source: Warranty Week from SEC data
The automotive sector usually accounts for around 45% of the total warranty claims paid, while the computer and electronics sector usually accounts for an additional 33%. But with the financial reports of so many major warranty players either late or missing data, right now it's difficult to tell if those ratios will hold true for 2006. Hopefully, by the time most of the annual reports begin to get filed with the SEC early next year, we'll have a bit more clarity on this topic.
In Figure 4, we're missing data from Dell and Motorola, but we now have data from Apple. Dell is under investigation by the SEC, and some say the investigation is directly linked to its warranty accounting procedures. Time will tell. Apple missed the deadline for both its fiscal third quarter and annual reports, which correspond to the calendar second and third quarters of 2006. And Motorola is one of the annual filers for which we won't have good data until March.
Figure 4
Top 10 High-Tech Warranty Providers:
Total Claims Paid,
Nine Months 2006 vs. Nine Months 2005
(in $ Millions and Percent)
| 9 Mo. '06 | 9 Mo. '05 | Change | |
| Claims | Claims | in | |
| Company | $ Mil | $ Mil | Claims |
| Hewlett-Packard Co. | $1,771 | $1,779 | -0.4% |
| Dell Inc. | na | $1,071 | na |
| IBM Corp. | $571 | $633 | -9.8% |
| Motorola Inc. | na | $537 | na |
| Cisco Systems Inc. | $289 | $287 | +0.7% |
| Sun Microsystems Inc. | $266 | $245 | +8.6% |
| Nortel Networks Corp. | $191 | $183 | +4.4% |
| Apple Computer Inc. | $190 | $153 | +24% |
| Honeywell International | $153 | $148 | +3.4% |
| Applied Materials Inc. | $134 | $146 | -8.3% |
Source: Warranty Week from SEC data
Although it's not very useful to compare companies against each other (especially if it's not clear what each is and isn't counting as a warranty expense), it is now becoming very easy to compare one company against itself over time. With a baseline of 45 months' worth of data, it is readily apparent when a company deviates from what in each individual case could be considered normal. One way to measure the change is in percentages. Another is in dollars.
In the following two charts, we've combined both dollars and percentages, looking for the ten companies with the largest percentage increases and decreases in the amount they spend on warranty claims. Let's start with the declines:
Figure 5
Top 100 U.S.-based Warranty Providers:
Largest Reductions in Claims Paid,
Nine Months 2006 vs. Nine Months 2005
(in $ Millions and Percent)
| 9 Mo. '06 | 9 Mo. '05 | Change | |
| Claims | Claims | in | |
| Company | $ Mil | $ Mil | Claims |
| Tyco International Ltd. | $63 | $96 | -34% |
| Medtronic Inc. | $33 | $48 | -32% |
| M.D.C. Holdings Inc. | $24 | $31 | -22% |
| Agilent Technologies Inc. | $51 | $59 | -14% |
| NCR Corp. | $34 | $38 | -11% |
| Armstrong Holdings Inc. | $26 | $29 | -10% |
| IBM Corp. | $571 | $633 | -9.8% |
| Palm Inc. | $56 | $61 | -9.2% |
| Applied Materials Inc. | $134 | $146 | -8.3% |
| Briggs & Stratton Corp. | $24 | $27 | -8.0% |
Source: Warranty Week from SEC data
Finally, here are the ten largest percentage increases in warranty spending, using the amounts reported during the first nine months of 2005 and 2006. Of course, none of the 18 companies that for one reason or another haven't filed their reports with the SEC are part of this list. And of course, it's not a problem to be on this list as long as product sales are growing faster than warranty outlays. Unfortunately, only one of the ten saw that happen. Of the remaining nine, eight saw sales increase, but none saw sales increase faster than their warranty spending.
Figure 6
Top 100 U.S.-based Warranty Providers:
Largest Increases in Claims Paid,
Nine Months 2006 vs. Nine Months 2005
(in $ Millions and Percent)
| 9 Mo. '06 | 9 Mo. '05 | Change | |
| Claims | Claims | in | |
| Company | $ Mil | $ Mil | Claims |
| Seagate Technology | $187 | $76 | +146% |
| Johnson Controls Inc. | $90 | $39 | +134% |
| Visteon Corp. | $46 | $25 | +84% |
| L-3 Communications | $25 | $14 | +74% |
| Jarden Corp. | $85 | $51 | +67% |
| Thermo Fisher Scientific | $27 | $17 | +62% |
| Harley-Davidson Inc. | $38 | $25 | +55% |
| American Power Conversion | $33 | $22 | +49% |
| Netgear Inc. | $25 | $17 | +45% |
| Gateway Inc. | $41 | $29 | +44% |
Source: Warranty Week from SEC data
Note that six of the ten companies listed in Figure 6 are also listed in Figure 2, which means they're among the top gainers in terms of both dollars spent on warranty claims and the fraction those amounts represent as a percentage of sales. However, not all the news is bad. Some of the companies are on the lists because of significant acquisitions they've made, such as is the case with Jarden, Johnson Controls, and Seagate Technology.
Then again, a few are on the lists because they really are seeing their warranty costs soar. Take Visteon, for instance. We went back to double-check out work when we found that Visteon had seen its quarterly claims soar from $8 million in the third quarter of 2005 to $33 million in the third quarter of 2006. That's more than the company has reported in any year since 2002. Figure 7 illustrates the magnitude of this increase.
Figure 7
Visteon Corp.
Warranty Claims & Accruals, 2003-2006
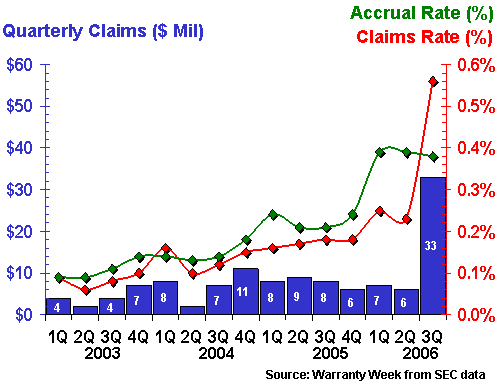
Visteon didn't include a single word about this mammoth increase in its most recent Form 10-Q. Still, these warranty expenses are only 1.3% of the company's third quarter product revenue, and only 0.6% of its year-to-date product revenue. And that latter number is about the same claims rate as Delphi was reporting as recently as June. Plus, claims in dollars were up by only 84% -- it was the 42% decline in sales that caused the tripling of Visteon's claims rate. So perhaps this anomaly isn't really so important that it deserves some kind of special explanation?
Supplier Recovery Effects?
And before anyone suggests this must be proof that supplier recovery efforts are finally posting some big numbers, note that former parent Ford is also seeing its warranty claims rate rise (though Ford's outlays were actually down $48 million from the second to the third quarter). Then again, one could say that Ford's claims rate might be rising even faster were it not for the success of supplier recovery efforts.
In Figures 8 and 9, we've spotlighted two of the other top gainers, who made the list primarily because of the effects of some recent acquisitions they made. Johnson Controls, another major automotive supplier, acquired the HVAC company York International about a year ago. And almost immediately, its warranty claims rate began rising. Some of that may also be related to supplier recovery efforts by the vehicle manufacturers, but we suspect most of the increase is due to the higher incidence and cost of warranty claims in the HVAC industry.
Figure 8
Johnson Controls Inc. & York International
Warranty Claims & Accruals, 2003-2006
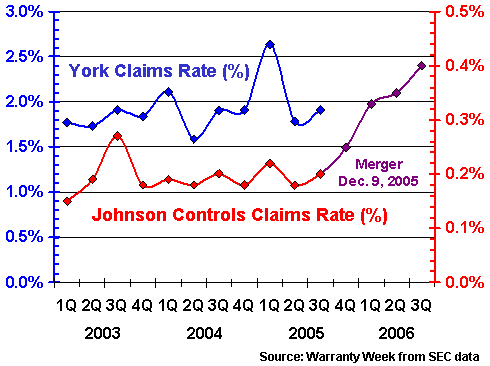
York is on the left-hand scale while Johnson Controls is on the right-hand scale. We tried to draw it so that the lines wouldn't intersect, but in reality, they were never close. Before the merger, Johnson Controls' claims rate was never higher than 0.27%. York International's was never lower than 1.6%. Or, to put it another way, out of 11 quarters, only once did Johnson Controls outspend York International on warranty claims in dollar terms, despite being more than six times as large as the company it eventually acquired.
Warranty Acquisitions
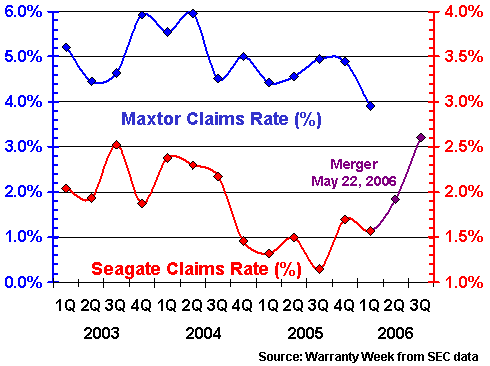
In May, disk drive manufacturer Seagate Technology acquired Maxtor Corp., which combined two former rivals into one great big company. As Figure 9 makes clear, Seagate always had a lower warranty claims rate than Maxtor. Now that they're one, Seagate's claims rate is on the rise. Some of that may be related to Seagate's lengthening of certain disk drive warranties to five years, but most of it has to do with the addition of Maxtor's product line.
In fact, although Maxtor reported just one quarter's worth of warranty expenditures before merging with Seagate, that single $34.4 million report would have been enough to rank Maxtor number 72 on our list of the top 100 warranty providers. However, since they were no longer providing warranties under their own name, we deleted them from the list, which in turn made room for E.I. du Pont, formerly ranked number 101.
Figure 9
Seagate Technology & Maxtor Corp.
Warranty Claims & Accruals, 2003-2006
Traditionally, manufacturers that end their fiscal years on Dec. 31 file their annual reports with the SEC at the beginning of March. So it will be three months at least before we know whether these trends are continuing. And it may be even longer before we know what's happening with some of the late filers.


