Telecom Equipment
Warranty Report:
The makers of network gear are generally seeing lower warranty costs, though their reserve funds are barely able to cover claims. And there's a new market leader, in terms of both the size of their warranty budget and the way they've been able to steadily reduce costs over time.
The makers of networking equipment for voice, data, wireless and video networks are enjoying lower claims rates and smaller warranty reserve balances than ever before, but they're beginning to set more aside to fund future warranty expenses as sales once again increase.
As can be seen in Figure 1 below, the collective amount paid in warranty claims by telecom equipment makers continued to fall in 2010. Claims declined by 4.2% to $1.406 billion in 2010, down from $1.467 billion in 2009. But the really spectacular decline took place in 2008-2009, when claims fell by 26%.
Figure 1
Telecom Equipment Warranties
Claims Paid by U.S.-based Companies
(in US$ millions, 2003-2010)

Claims peaked in this sector in 2006, at a level of $2.142 billion. Claims declined by 11% in 2007 but then grew by 4% in 2008, before falling for two consecutive years and counting.
We don't usually include a chart for claims in each weekly issue, since we covered that metric so thoroughly in the April 1 newsletter. However, for the telecom equipment sector, we had to modify the totals significantly to account retroactively for the split-up of Motorola Inc. into two entities. Even chopped into two pieces, the company remains the second- and third-largest warranty provider in the telecom equipment sector. So we're including the revised claims totals here in addition to a chart just for Motorola (Figure 7).
Warranty Accruals
The big news in terms of telecom equipment warranty accruals is the massive jump in the amounts set aside by manufacturers in 2010. Accruals fell for three years in a row, but were up 12% in 2010 to a total of $1.544 billion.
The reason this is so important is because accruals reflect what companies believe they will spend in the future. So the companies are signaling that either they foresee a massive decline in product quality, or a massive increase in product sales. We suspect it's the latter.
Figure 2
Telecom Equipment Warranties
Accruals Made by U.S.-based Companies
(in US$ millions, 2003-2010)

Telecom equipment warranty accruals peaked in 2006 at $2.2 billion. Part of the reason for the decline since then is the departures of several major players, either through acquisitions (Lucent by Alcatel) or through bankruptcies (Nortel). Warranty spending by European and Asian manufacturers is not included here, though of course it still occurs. So while Alcatel Lucent still generates a significant amount of warranty accruals, it's a net decline in these charts.
Besides the metrics of warranty claims and accruals, we also collect product sales data for each manufacturer, measured over the same quarterly or annual period as the warranty data. And with those data points, we calculate claims and accrual rates for each company and for the industry as a whole.
Those claims and accrual rates are detailed in Figure 3. Although the claims and accrual totals in Figures 1 & 2 consist of eight annual totals each, the averages in Figure 3 consist of 32 quarterly measurements collected over the past eight years.
The quarterly format makes the data look more volatile, but it doesn't obscure the generally downward trend seen during the past five years. Back in 2003-2006, the industry averaged 1.6% to 1.8%, with occasional dips to 1.4% or 1.5%. By 2010, the range had declined to 1.2% to 1.5%, and neither the claims nor the accrual rate have been above 1.6% since early 2008.
Figure 3
U.S.-based Telecom Equipment Companies
Average Warranty Claims & Accrual Rates
(as a % of product sales, 2003-2010)

Accruals, both in terms of dollars (Figure 2) and as a percentage of sales (the green line in Figure 3) bottomed out in 2009. But while the accrual total measured in dollars rose 12% in 2010, the accrual rate remained low. This suggests that telecom equipment makers were reacting to an increase in sales, rather than a deterioration in product quality.
Warranty Reserves
The other warranty metric disclosed by U.S.-based manufacturers is the balance in their warranty reserve funds at the beginning and end of each period. In this case, in Figure 4, we're measuring the balance at the end of each of the past eight years.
As can be seen in this chart, the balance for telecom equipment makers has been falling every year since 2003. The biggest decline was -22% in 2008-2009, while the smallest was -0.02% in 2007-2008. Yes, in each case the year-end balance was $1.684 billion, but the less-rounded-off balance was $1.6839 billion in 2007 and $1.6836 billion in 2008.
Figure 4
Telecom Equipment Warranties
Reserves Held by U.S.-based Companies
(in US$ millions, 2003-2010)

There's not much we can say about these balances, except to note that they're declining because 1) less product is being sold, 2) the products that are sold now generate less warranty cost than they used to, and 3) some of the biggest players in the telecom industry went abroad or went to the bottom and took their warranty reserves with them.
In other words, a falling warranty balance can be a good thing, but it also can be a bad thing. In this case, it's a bit of each, because in Figure 3 we can see that the industry is spending less per unit of revenue than it used to, but in Figures 1 & 2 we can see the recession-related declines in claims and accruals were also massive in 2009.
But what if we measures the balance a different way? What if we measured it as a multiple of the monthly spending on claims? So if a company is spending $1 million a month on warranty claims, and if their balance in the warranty reserve fund is $15 million, then one could say their warranty reserve's capacity was 15 months. If the claims rate jumped to $1.5 million per month but the reserve balance remained unchanged, then the capacity would change to 10 months.
We've calculated this average reserve capacity for all U.S.-based manufacturers, and the average in 2010 was 16.7 months, up from 15.5 months in 2009. But for just the telecom equipment manufacturers, the average capacity in 2010 was 11.5 months, down from 11.8 months in 2009.
What we've done in Figure 5 is compare the telecom manufacturers to all manufacturers. And it shows that in 2003, the average capacity for telecom equipment makers was very close to the average for all manufacturers. But then it began to drop, and it dropped as low as 10 months in 2008.
Figure 5
Telecom Equipment vs. U.S. Mfg. Avg.:
Reserves Held by U.S.-based Companies
(in $ millions & months, 2003-2010)

This certainly puts the drop in the industry's warranty reserves in perspective. It wasn't so much because there were less claims, and therefore less need for reserves. And it probably wasn't caused by telecom equipment warranties getting shorter, and therefore reducing the need to hold funds in reserve. Simply put, the reduction in reserves was caused by the need to reduce reserves.
Cisco at the Top
With the acquisition of Lucent, the demise of Nortel, and the partition of Motorola, the leadership of the telecom equipment industry in terms of warranty providers has changed significantly over the past eight years. Now there's a new leader: data network infrastructure provider Cisco Systems Inc.
With our restatement of Motorola's 2008 and 2009 warranty expenditures (see Figure 7), it turns out that Cisco was also the leader in telecom warranty provision in 2009. During that year, it paid $437 million in claims, significantly more than Motorola Solutions ($290 million) or Motorola Mobility ($219 million) did on their own (although technically, they didn't exist until earlier this year).
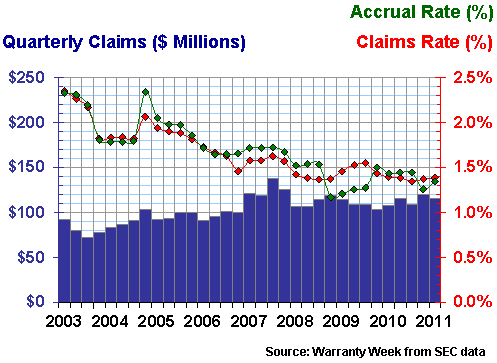
In Figure 6, we've charted the warranty expenses of Cisco for the past eight years, in the form of 33 quarterly measurements. Note that Cisco is on a fiscal year schedule that ends on July 31, so we've mapped what it would call its fourth fiscal quarter to the third calendar quarter in the charts below. And because Cisco has already reported its warranty expense for the quarter ended January 29, 2011, we've already begun their chart for calendar 2011.
Figure 6
Cisco Systems Inc.
Warranty Claims & Accrual Rates, 2008-2010
(as a percentage of product revenue)

Notice how the claims total generally rises from one quarter to the next. Back in 2003, the claims total was as low as $72 million per quarter, or $24 million per month. But the last quarter below $100 million was in 2006, and in calendar 2010 it rose as high as $120 million per quarter, or $40 million per month.
Not to worry. Cisco's claims rate was last over two percent in late 2004, and the accrual rate last saw that level in early 2005. Revenue has risen faster than warranty costs ever since, so the claims and accrual rates have steadily declined. Accruals dropped below claims in 2009, but rose back above claims in 2010. So all is well with the Cisco warranty metrics.
Motorola Splits In Two
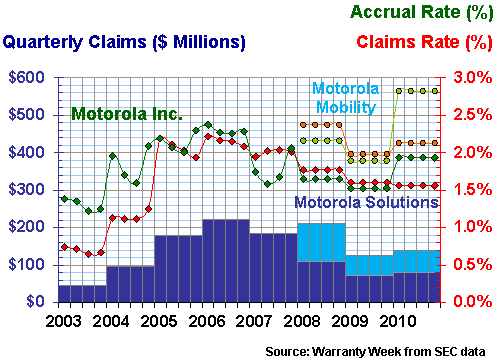
Finally, we wanted to spotlight the two parts of Motorola Inc. as if they'd been separate entities since 2008, even though the separation didn't formally occur until January 4, 2011. So what we're showing in Figure 7 is a bit of a financial fiction. But Motorola Inc. didn't publish an annual report for 2010. Instead, Motorola Solutions took its place. And both Motorola Solutions and Motorola Mobility published their financial statements as if they were separate all along.
For 2010, Motorola Solutions reported $ million in claims and $ million in accruals, and Motorola Mobility reported $ million in claims and $ million in accruals. Each company also reported their warranty expenses in 2008 and 2009. In the chart below, Motorola Solutions takes over the 2003-2007 lines for Motorola Inc., while Motorola Mobility gets its own new and lighter-colored lines.
Figure 7
Motorola Inc. (and spin-offs)
Warranty Claims & Accrual Rates, 2008-2010
(as a percentage of product revenue)

The claims and accrual rates for Motorola Mobility Holdings Inc. are in orange and light green, respectively, while the rates for Motorola Solutions Inc. are in red, green. The claims totals for Motorola Mobility are in light blue, and the claims totals for both Motorola Inc. and Motorola Solutions are in dark blue. Motorola Solutions is considered to be the successor to Motorola Inc., while Motorola Mobility is the new and separate company.
In 2010, Motorola Solutions reported $301 million in claims, which is about 55% of the combined $545 million that it and Motorola Mobility reported in claims. Yet Motorola Solutions accounted for almost 63% of the combined entities' revenue. It therefore has a lower claims rate than its spin-off.
That pattern holds in previous years as well. In 2009, Motorola Solutions accounted for 57% of the warranty claims but 62% of the revenue. In 2008, Motorola Solutions accounted for 52% of the warranty claims but 59% of the revenue. And in each of those years, Motorola Solutions had a lower claims rate.
What can we infer from this? Motorola Mobility's mobile phones and Android-powered smart phones must have a higher average warranty cost (per unit of revenue) than Motorola Solutions' network infrastructure equipment and hand-held computers.
Eighth Annual Product Warranty Reports
Here are the links to the online editions of all eleven parts of this series:
- Top 100 Warranty Providers of 2010
- 2010 Warranty Totals & Averages
- Automotive Warranty Report
- Aerospace Warranty Report
- Computer Warranty Report
- Disk Drive & Semiconductor Report
- Telecom Equipment Warranty Report
- Medical & Scientific Equipment Warranty Report
- New Home Warranty Report
- Fixtures, Furniture & Building Material Warranty Report
- Appliance & HVAC System Warranty Report
Readers needing more detailed snapshots of individual companies in either a PowerPoint or Excel format are invited to view the list of charts and spreadsheets available on the Warranty Statistics page.
Warranty Report: Though there is a strong seasonal pattern that drives their warranty costs up in the summertime, companies in this sector have generally been able to reduce those costs from year to year. Even the companies making warranty-intensive X-ray and laser equipment have been cutting costs in recent years.May 12, 2011


