Fixtures, Furniture & Building
Material Warranty Report:
Sales have fallen but warranty costs aren't falling as fast. Still, it's not as bad as things in the new home industry, because suppliers can fall back on existing home renovations.
The total amount of warranty claims reported by makers of electrical and plumbing fixtures, furniture, and building materials declined in 2010 for the third time in four years. The total amount of claims reported in 2010 was $729 million, down 14% from 2009 levels.
Surprisingly, however, considering the general weakness of the economy in 2009, that was an up year, with claims increasing by 7.7% to $846 million. Equally surprising, the declines in 2007 and 2008 were barely noticeable, as can be seen in the data of Figure 1 below.
Figure 1
Fixtures, Furniture &
Building Material Warranties
Claims Paid by U.S.-based Companies
(in US$ millions, 2003-2010)

As with the new home builders we covered in last week's newsletter, the peak for their suppliers came in 2006. But unlike the homebuilders, the declines in the years since were slight -- except for 2010. The best explanation we can think of for this divergence is the lag time between builders and their suppliers. Perhaps homes built in 2006 became claims paid in 2007, and then the builders' claims of 2007 were charged back to their suppliers in 2008?
Accruals Decline
Accruals are a bit easier to explain. Since accruals represent the amount set aside at the time of sale, they should decline in exact proportion to sales unless there's been a change in quality or repair cost. And within the building material supplier sector, accruals declined at an accelerating rate since peaking in 2007.
As can be seen in Figure 2 below, the 2007 peak was at a level of $886 million accrued by companies in this sector. There was a 6.3% decline in 2008, followed by a 12% decline in 2009 and a 15% decline in 2010.
Figure 2
Fixtures, Furniture &
Building Material Warranties
Accruals Made by U.S.-based Companies
(in US$ millions, 2003-2010)

In contrast, the homebuilders saw accelerating rates of decline in their accruals in 2006-2009, followed by (only) an 8% decline in 2010. So if there is a lag time between the builders and their suppliers, we should expect to see a decline of much less than 15% among the suppliers in 2011.
Currently, in this sector we're tracking 52 current and 43 former warranty providers, for a total of 95 building material suppliers that have reported warranty expenditures in at least one of the years between 2003 and 2010. Some of the former reporters, such as Black & Decker Corp., have been acquired. Other former reporters, such as Ethan Allen Interiors Inc., include their warranty expenses in their annual reports during some years but not in others.
Warranty Reserve Balances
The imbalance between claims and accruals has varied considerably over the past eight years. Basically, when the industry is growing, accruals exceed claims, as they did during each of the years from 2003 to 2008. But when the industry is contracting, sales and accruals usually fall faster than claims, because of that lag time between when a product is sold and when it needs a repair.
When sales plummet, the imbalance becomes severe. And indeed, in 2009 there was a $112 million negative imbalance, while in 2010 there was a $103 million imbalance.
Figures 1 & 2 present the claims and accrual data in raw dollar terms. In Figure 3, we've compared those dollar amounts to the sales volumes reported over the same period. And to show how severe the fluctuations have been in recent years, we've presented the calculations of claims/sales and accruals/sales in a quarterly format, with 32 measurements of each ratio over the past eight years.
Figure 3
Fixtures, Furniture &
Building Material Suppliers
Average Warranty Claims & Accrual Rates
(as a % of product sales, 2003-2010)

As the data illustrates, claims and accrual rates rose gradually from 2003 to the middle of 2009. But then at the very end of 2009, the industry's average claims rate soared above one percent for the first time. And it hit that level again in the middle of 2010. This, we would suggest, is entirely due to the lag time between when a product is sold and when it needs warranty work.
The confirmation of this theory is in the accrual rate, which has shown a strong seasonal pattern over the years but which has remained within a much narrower range. The highest accrual rate was just above 0.9%, in 2007, while the lowest was just below 0.7%, a level reached in both 2004 and 2005.
Declining Reserves
As one would expect from these gyrations in additions and subtractions, the industry's warranty reserve fund balance has fluctuated significantly over the past few years. Reserves peaked at the end of 2007 at a level of $1.075 billion, after a huge 27% gain that year. And they've fallen ever since, at a still-accelerating rate of decline.
As can be seen in Figure 4, the balance fell slightly in 2008, fell by 6% to just over $1 billion in 2009, and by -12% to $880 million by the end of 2010. Yet the total amount of reserves was still above 2006 levels by the end of 2010.
Figure 4
Fixtures, Furniture &
Building Material Warranties
Reserves Held by U.S.-based Companies
(in US$ millions, 2003-2010)

There are additional adjustments made to the warranty reserve balances (acquisitions, foreign exchange fluctuations, changes of estimate, etc.) that also factor into the equation, so the imbalances between the data in Figures 1 & 2 are not always precisely reflected in Figure 4. But in general, they show the same trend: accruals and reserves peaked in 2007, while claims peaked in 2009.
Capacity to Pay Claims
Another way to look at the warranty reserves detailed in Figure 4 is to express them not in dollars, but as a multiple of the amount paid out each month in claims. If the reserve balance was $1 billion and the monthly rate of claims payments was $100 million, the capacity of the reserve funds would be exactly 10 months. If reserves fell to $800 million and claims grew to $200 million a month, the capacity would fall to only four months.
Fortunately, quite the opposite trend is evident in the data for this industry. From 2003 to 2007, the industry's capacity to pay claims gradually grew from 13 months to 15 months. It remained at that level until last year, when it rose again.
As can be seen in Figure 5, the industry's capacity now stands at 17 months. And for the first time, it's above the capacity for all manufacturers in all industries, if ever so slightly. This means that at current levels, the makers of building materials report warranty reserves sufficient to pay claims for the next year and five months. But of course, over that period the amount of claims will also vary.
Figure 5
Fixtures, Furniture &
Building Material vs. U.S. Average:
Reserves Held by U.S.-based Companies
(in $ millions & months, 2003-2010)

This in a way is good news. As we detailed in last week's newsletter, the homebuilders also crossed the median, and are now above the average claims-paying capacity of all manufacturers. But they were slightly below the median from 2003 to 2006, and have been significantly above it ever since.
This suggests that the homebuilders have allowed their claims, accruals and reserves to get out of balance, which is no surprise given the massive downturn in sales. But for their suppliers -- the makers of fixtures, furniture, and building materials that we're surveying this week -- the extremes were less, well, extreme. If we had to come up with a reason, we'd suggest it may have a lot to do with the fact that existing homes continue to be renovated even as the new building market slowed to a crawl.
Floors & Cabinets
What's remarkable is that some of these suppliers have gone through incredible levels of adversity of their own, and have still come out in good shape. For instance, Armstrong World Industries fell on hard times long before the builders, with asbestos lawsuits and other factors driving it into bankruptcy way back in 2000. It didn't emerge from that process until late 2006 -- just in time for the homebuilding crisis to begin.
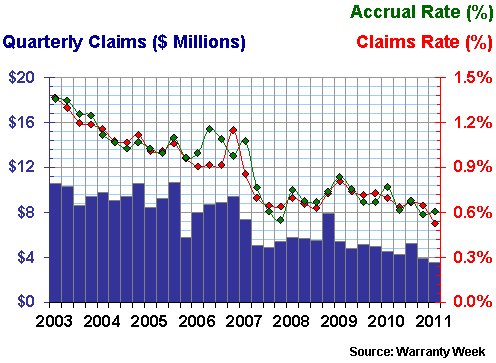
But take a look at the data in Figure 6. If we put no name on the chart, you'd still see the gradual reduction in warranty costs, both in dollars and as a percentage of sales. When warranty expense reporting began in 2003, the company had claims and accrual rates close to 1.4%. Now both metrics are well under half those levels.
Figure 6
Armstrong World Industries Inc.
Warranty Claims & Accrual Rates, 2008-2010
(as a percentage of product revenue)

Most of that improvement, in fact, has come since Armstrong emerged from its Chapter 11 reorganization in October 2006. And it seems to be continuing. Armstrong's claims rate reached its lowest level ever at the end of 2010, while its accrual rate hasn't been this low since 2007.
Faucets & Cabinets
If Armstrong is representative of the flooring industry, Masco is one of the best representatives of the plumbing fixture industry. And like Armstrong, its brands are well-known in both the home improvement and new home construction markets.
Masco was actually founded as an automotive parts supplier. It wasn't until it developed the single-handle hot/cold faucet 60 years ago that the product line began to drift away from that automotive focus and towards the building trades.
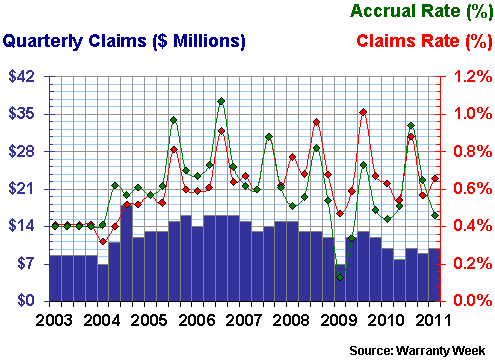
In Figure 7, the data goes back only to 2003. And actually, because the company didn't begin reporting its warranty expenses on a quarterly basis until 2004, the data for 2003 is estimated based on that year's annual report.
What that data suggests is that Masco's plumbing, cabinetry, shelving, window and building material business is highly seasonal, with obvious peaks occurring in every third quarter since 2005. But at the same time, the claims total has generally been in a range of $12 to $15 million per quarter, with no obviously seasonal peaks. So this suggests that the actual cause of the seasonality has more to do with sales and less to do with claims or accruals.
Figure 7
Masco Corp.
Warranty Claims & Accrual Rates, 2008-2010
(as a percentage of product revenue)

There is that one quarter in early 2009 when both the claims and accrual rates fell to unusually low levels. But if we set that quarter aside as an outlier, we can see that those rates have generally been in a range of 0.5% to 1.0%.
We can't compare one company against another, because it's probable that they each have their own way of counting warranty expenses. However, we can compare a company against itself over time, especially now that we have more than eight years of data (each of these three charts also includes data for the first quarter of 2011).
Establishing a Baseline
And if we assume that the data since 2003 provides something of a baseline, we can draw conclusions, such as that Armstrong has been reducing its warranty costs, or that Masco has a seasonal sales pattern. The reason we mention this is because in Figure 8, we can see quite clearly what happens when a company deviates from that baseline.
Figure 8
Mohawk Industries Inc.
Warranty Claims & Accrual Rates, 2008-2010
(as a percentage of product revenue)

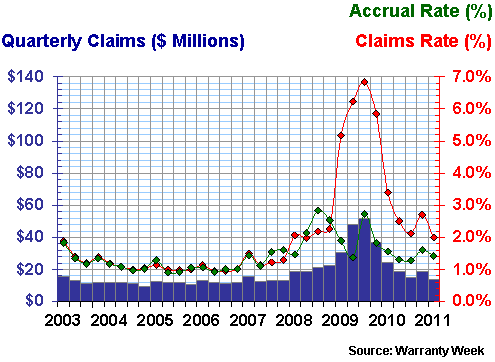
Mohawk Industries, which in warranty terms is best-known for its residential and commercial carpeting, never exactly said what the problem was in 2009, but the chart above illustrates that there was a problem. In its annual report from that year, Mohawk said the increased warranty cost "relates primarily to certain commercial carpet tiles that were discontinued in early 2009," and more specifically the backing used for those tiles, but doesn't go into any detail.
In that year, however, claims clearly soared, both in dollar terms and as a percentage of sales. And when they both soar together, we can conclude it was a problem with the product, and not just a seasonal pattern in sales. Claims soared from $81.6 million in 2008 to $167 million in 2009, and Mohawk was forced to add an extra $125 million to its warranty reserve in response (a so-called change in estimate adjustment).
There had been a massive write-down in goodwill in 2008, which caused an annual net loss that year. But the net loss in 2009, while much smaller, was quite likely caused by the problems with the carpet tile line of business. And, we should note, the company returned to profitability in 2010, as warranty claims fell back to a "normal" level of $77 million.
Absent from this review are the suppliers of household appliances and heating, ventilation and air conditioning systems. Those we shall tackle next week, followed a week later by a cross-industry analysis of the companies providing "green" energy technology (solar, electric vehicles, etc.).
Eighth Annual Product Warranty Reports
Here are the links to the online editions of all eleven parts of this series:
- Top 100 Warranty Providers of 2010
- 2010 Warranty Totals & Averages
- Automotive Warranty Report
- Aerospace Warranty Report
- Computer Warranty Report
- Disk Drive & Semiconductor Report
- Telecom Equipment Warranty Report
- Medical & Scientific Equipment Warranty Report
- New Home Warranty Report
- Fixtures, Furniture & Building Material Warranty Report
- Appliance & HVAC System Warranty Report
Readers needing more detailed snapshots of individual companies in either a PowerPoint or Excel format are invited to view the list of charts and spreadsheets available on the Warranty Statistics page.
Warranty Week Joins Facebook
By the way, Warranty Week recently joined Facebook, and we've begun posting links to our weekly newsletters on the page called "Warranty Week." If any of our readers are Facebook users, we encourage you to "like" the page and to write on its wall. If nothing else, it's a good way to get around the spam filters and corporate firewalls that sometimes impede delivery of the email and web editions of this newsletter.
Warranty Report: Every journey includes a few bumps, and both appliance and HVAC makers have hit a few in the past couple of years. But like other building material suppliers, they're doing much better than the homebuilders, because they have both home renovations and replacements to fall back on.June 2, 2011


