

Sixteenth Annual Product Warranty Report:
Warranty costs are rising but sales are rising faster, meaning that the percentage of revenue consumed by warranty expenses remains at the low end of a decade-long decline. But can expense rates go even lower, or are we at the bottom now? A look at the totals and averages in 2018.
March is the month that most manufacturers release their annual reports, and so it's also the time of year that we traditionally publish a tally of all the claims, accruals, and warranty reserves detailed in those financial statements. This year, we're going to start off with a high-level snapshot of the totals and averages, and then in subsequent weeks we will go deeper into specific industries and examine the warranty metrics of specific companies.
Since 2003, all public companies that use the accrual method have been required to disclose the size of their warranty expense accounts. According to the rules of the Financial Accounting Standards Board's FASB Interpretation Number 45 (FIN 45), and later under Accounting Standards Codification 460 Guarantees, specifically ASC 460-10-50-8c, product warranty providers are required to disclose the beginning and ending balances in their warranty reserve funds, the amounts added to them as accruals, the amounts paid from them in claims, and any adjustments made for acquisitions, divestments, foreign exchange fluctuations, or changes of estimate.
Hundreds of companies have followed the rules, by including warranty tables in the notes of their annual reports and quarterly financial statements. Each quarter, we gather this data, along with figures for warranted product sales, so we can present five warranty metrics: claims paid, accruals made, reserves held, and two expense rates: claims as a percentage of sales, and accruals as a percentage of sales.
From 2003 to 2010, we were gathering data from upwards of 700 U.S.-based manufacturers and a handful of retailers -- mostly auto parts outlets that add their own store brand of warranty to items such as batteries. But in recent years, acquisitions have caused a significant amount of attrition, leaving us with barely 400 companies to follow in 2018. Fortunately, many of the acquiring companies report the merged balances in their warranty tables, but some consider it to be immaterial, some are themselves privately-held and therefore do not report, and some are foreign-based and are not required to report (although many of the larger ones still do so).
A handful of companies have decided to report their warranty expenses only once a year, but fortunately most of those end their fiscal years on December 31, so their once-a-year reports are included in the data below. And some have decided to report only their beginning and ending balances. Since enforcement by the U.S. Securities and Exchange Commission is sporadic, we have to be thankful there is any warranty data at all. Before 2003, there was none.
By the way, the feared rash of warranty-not-warranty restatements provoked by adoption of the new revenue recognition standards within ASC 606 and IFRS 15 has largely failed to materialize. KLA-Tencor Corp. and Netgear Inc. remain among the largest companies to reclassify large amounts of warranty reserves as non-warranty funds. There was more activity reclassifying past service revenue as deferred revenue, and a bit more extended warranty disclosures. But the impact of ASC 606 on product warranty was minimal.
Warranty Claims Paid
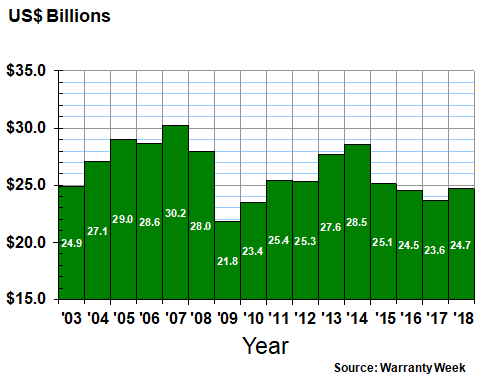
In Figure 1, we are taking a simple total of all the reported claims paid by U.S.-based warranty providers on their worldwide product sales. In calendar 2018, they reported $26.1 billion in claims paid, up about $1.38 billion or 5.6% from 2017 levels. Note, however, that claims have remained relatively close to that $25-to-$26 billion range for the past eight years.
Figure 1
Worldwide Warranty Claims
of U.S.-based Companies
(claims paid in US$ billions, 2003-2018)

Notice also how claims rose every year from 2003 to 2008, then fell for two years during the recession before leveling off in their current range. The unseen metric is product revenue, which has been going up even as claims remained flat, signaling that the quality and reliability of the products in question has been rising as well. We will see more evidence of that in Figure 3 below. Suffice it to say that rising claims are good if sales are rising faster, and stable claims are good if sales are rising at all.
Warranty Accruals Made
It's a slightly different story for warranty accruals. These are the amounts that manufacturers set aside at the time a product is sold, using their best estimates of what future claims costs will turn out to be. Therefore, the accruals are made first, when the product gets into the hands of a customer, then the claims are paid later, when the actual warranty work is done.
The amount of accruals made are therefore almost always wrong -- too high or too low. It's a bit like looking out the window and deciding whether or not to grab the umbrella. Sometimes the manufacturer expects trouble but it never arises, and their accrual rates turn out to be too high. Sometimes they expect clear skies but then something unexpected happens, and their accruals are too low.
In Figure 2, note that accruals peaked in 2007, a full year before claims did, suggesting that manufacturers correctly predicted that lower claims rates were ahead (because of lower sales totals). But also note that there was a secondary peak in 2014, followed by a few years of declines. Those didn't happen because sales were falling. Quite the opposite: manufacturers correctly predicted that claims would remain the same while sales rose.
However, there is still an unexplained gap between the amount of claims paid and the amount of accruals made. In seven of the past 10 years, claims have exceeded accruals. In 2016, the gap between them was nearly $1.9 billion wide. Last year and in 2015 it was $1.4 billion. Some manufacturers fill the gap with changes in estimate (which are not included in these charts) but some simply allow the deficit to result in lower warranty reserve balances (which are shown in Figure 4).
Last year, accruals rose for the first time since 2013-14. They came close to topping the $24.7 billion mark, rising by $1.02 billion or 4.3% from 2017 levels. And that almost compensated for the $895 million decline from 2016 to 2017 and the $564 million decline from 2015 to 2016. But not quite: the totals have been higher in 11 of the previous 15 years.
Figure 2
Worldwide Warranty Accruals
of U.S.-based Companies
(accruals made in US$ billions, 2003-2018)
The absolute size of the totals is one thing. Their relative size is something entirely different. If a car is not sold, it doesn't matter how well it was made. If sales double but expenses don't, profitability will rise and investors will be pleased. many companies measure warranty costs per unit sold, but as external observers this is difficult for us to do. So instead, we measure warranty expenses as a percent of sales.
Percentage of Sales
In Figure 3, we've taken the data from Figures 1 and 2, chopped it up into four quarters, and divided it by warranted product sales. Most companies do a very good job of segmenting their revenues into products and services, and they also segment their product sales into hardware vs. software, systems vs. consumables, and manufactured products vs. basic materials. So it's possible to focus on just the warranted product sales totals.
Since many products such as food, apparel, fuel, and chemicals do not carry express written warranties, we also have to make deductions for those wherever possible. For most software, the warranties are limited to bug fixes, and for most consumables, the warranties are limited to replacements. And for most military sales, either the warranties are paid for by the customer, or they're not available.
In 2018, that leaves us with just over $2 trillion in warranted product sales made by U.S.-based companies. In recent years, we have been able to broaden that measure worldwide for select product categories, such as passenger cars, civilian aircraft, and construction equipment, and to make educated guesses about their corresponding warranty expenses. And we will do so again in the months ahead. But for this week, we will look at just the U.S.-based data that we already have in hand.
Figure 3
All U.S.-based Companies
Average Warranty Claims & Accrual Rates
(as a % of product sales, 2003-2018)
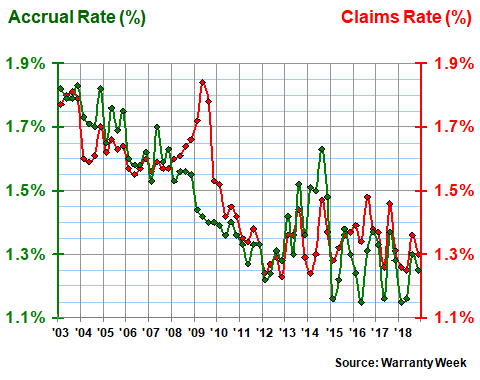
There are two stories to be told by the data in Figure 3. First is the more or less continuous decline in expense rates seen from 2003 to 2012. Back in 2003, manufacturers were spending an average of 1.8% of their sales revenue on warranty. Except for the recessionary year of 2009 (when sale plummeted but claims did not), the decline continued for a decade, before bottoming out at the 1.3% level. It doesn't sound like much, but 0.5% of $2 trillion is $10 billion per year in cost savings. But that's money not spent, so it's hard to fathom.
The other story to be told by the data in Figure 3 is what's happened since 2012. Warranty expense rates rose, driven by product recalls and unexpected manufacturing glitches. Then expense rates fell, then they rose, then they fell again. There has been no consistent trend for the past six years, although since 2015 the accrual rate has fallen under 1.2% for at least one quarter of the year. Then again, in four of the past six years, the claims rate has risen close to 1.5% in eat least one quarter.
Some of that is seasonal -- for instance, farm equipment is sold in the spring and fixed in the fall. And some is related to massive recall expenses, such as those suffered by General Motors Co. with its ignition switch failures. But the point is, the decade-long trend of manufacturers gradually reducing their warranty expenses seems to have ended in 2012. Still, after saving themselves $10 billion a year, maybe there's little left to do but maintain?
Warranty Reserves Held
The other metric we can measure is the balance left in the warranty reserve funds of all the manufacturers that include such figures in their financial reports. This is a bit trickier to interpret, because some manufacturers do not choose to report their claims and accruals -- only their beginning and ending balances. Others seem to deliberately lowball their accrual rates, making up for their "errors" with upwards changes of estimates.
Curiously, Wall Street analysts seem to reward this behavior. If a manufacturer underestimates their accruals, their net income rises. And if they later correct it with a change in estimate, the analysts interpret this as a "one-time charge," and discount its impact from their year-to-year earnings comparisons. Again, the SEC is asleep at the switch, so this behavior goes unnoticed. But it has become much more pronounced in recent years, with the average claims rate exceeding the average accrual rate in 15 of the last 16 quarters.
In Figure 4, the balances reported by manufacturers during the fourth quarter of calendar 2018 fell by $977 million to $42.0 billion. That was the third decline in the last four years (their balances actually rose by 0.1% from 2015 to 2016, though it appears unchanged in the chart).
Figure 4
Worldwide Warranty Reserves
of U.S.-based Companies
(reserves held in US$ billions, 2003-2018)
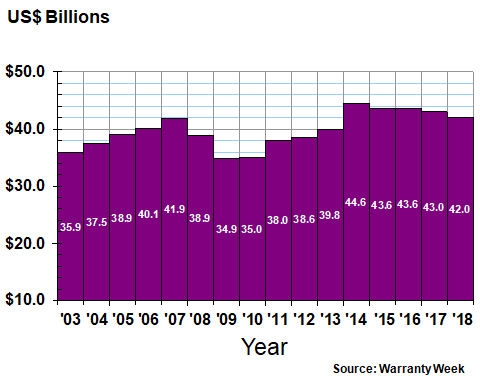
However, also notice that unlike in Figures 1 and 2, the peak for this metric is more recent, in 2014, although the deepest cut in the valley is again in the recessionary year of 2009. We don't know what to make of this difference, except to again point to the massive cost of the GM ignition switch recalls and other incidents, which are gradually working themselves out of the totals as claims are paid and cases closed.
Totals for Three Industry Sectors
We take the data from the above charts and refine it further into 18 different industry categories, divided into three sectors: vehicles, electronics, and buildings. In future newsletters, we will take deep dives into each of these industries, looking at the individual companies as well as the overall totals and averages. This week, we will highlight just one of the metrics: claims paid.
The automotive sector accounted for just over half of all the warranty claims reported last year by U.S.-based manufacturers, slightly higher than their historical average. The electronics sector accounted for 32%, which was below average, while the buildings sector accounted for the remaining 18% -- a record high share.
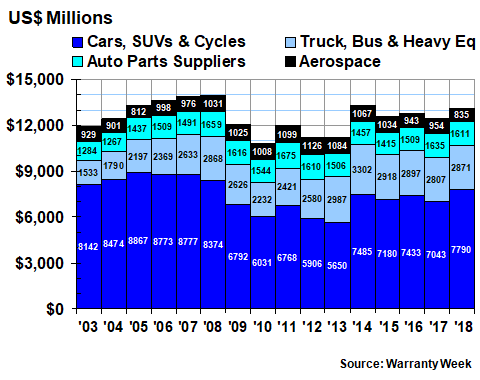
In Figure 5, we're looking at just the vehicles sector. We now divide the automotive industry into large and small vehicles, as well as separately counting their parts suppliers. There are also some boat and train manufacturers and suppliers mixed in there. And, thanks to a reader's suggestion, we also include airplanes in this sector, since indeed they are vehicles. In this case, the aviation OEMs and their suppliers are mixed together, but in a future newsletter, we'll separate them.
Figure 5
Worldwide Warranty Claims Payments
of U.S.-based Vehicle Makers
(claims paid in US$ millions, 2003-2018)
Wherever space is sufficient, we're including industry totals. But for some industries, it's not possible, because either they're too small or because so many major players have been acquired or gone private. In some cases, companies are counted in the wrong category given their product lines (e.g. Apple Inc. is still counted as a computer manufacturer even though the bulk of their revenue is from mobile phone handsets). But in most cases, they're in the group one would expect.
Overall, six of the 18 industry categories saw their claims totals fall last year, while 12 saw claims increase. In future newsletters we will detail their gains or declines as a percent of sales. This week, we will look at just the dollar volume. But for now, let's just say that warranted product sales were up somewhere between 7.7% and 8.7% last year, depending on how we treat the totals of companies whose fiscal years end in months other than December.
Within the vehicle sector, aerospace manufacturers saw a 12% decline in claims, while small vehicle makers saw an 11% increase. The truck manufacturers and all parts suppliers as a group saw just small changes in their claims totals.
Claims in the High-Tech Sector
In the high-tech electronics sector, three industry groups were up and four were down. But they nearly offset each other, with only an 0.4% decline reported for the sector as a whole. In Figure 6 it is apparent that there were massive declines in the claims totals of the telecom equipment and data storage industries, but those were caused primarily by acquisition-related departures (e.g. private company Dell acquired data storage company EMC, thus removing its warranty expenses from the totals).
The consumer electronics group, meanwhile, has gotten even smaller now that Harman International Industries was acquired by Samsung. Ever since the Xbox 360 episode subsided a decade ago, this category has been dominated by imports and foreign-owned manufacturers, so that now the remaining domestic producers account for a barely-visible $86 million in claims. It is much more important on the retail side, however, where extended warranties and service contracts are sold on the imports as well as the remaining U.S.-based production.
Figure 6
Worldwide Warranty Claims Payments
of U.S.-based High-Tech Manufacturers
(claims paid in US$ millions, 2003-2018)
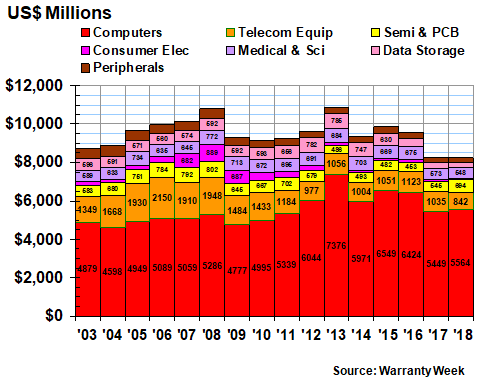
Meanwhile, the semiconductor and printed circuit board manufacturers saw their claims total soar by 27% -- the largest increase of any of the 18 industries followed. Second place was the 25% gain in claims reported by the major appliance and HVAC manufacturers, which led the gains in the buildings sector below, in Figure 7. Both of these industries will merit further scrutiny in the coming months.
Claims in the Building Trades
In the building trades, claims were up in all seven industry categories. Altogether, their claims were up by $745 million, a 19% increase. And it's hopefully a good omen that the "OEMs" in this sector -- the new home builders -- saw a 22% increase in claims, on top of a 10% increase in units sold, suggesting that their suppliers are also seeing expenses rise because of increased demand. But it will take a few more months before we get to all the details.
Figure 7
Worldwide Warranty Claims Payments
of U.S.-based Building Trade Companies
(claims paid in US$ millions, 2003-2018)
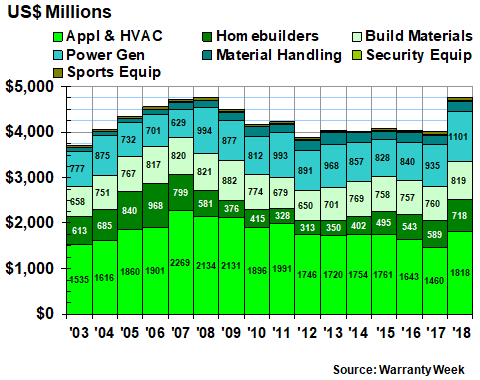
Some of the industry categories included in this sector definitely belong there, such as security equipment, building materials, and appliances/HVAC. Others such as power-generating equipment only partially belong there, in that some residential solar power systems are installed on rooftops. But material handling equipment and sports equipment? We look forward to a reader suggesting a better name for the non-vehicle and non-electronic sector than simply "buildings."
We should note that around 40 companies have either officially told the SEC that their final financial report for 2018 will be filed late, or they have not filed such a report before today but will do so in a week or two. However, we expect their collective contribution to the above totals and averages to be less than $100 million or 0.1%. In other words, the final figures still might change, but not by much.
So let's put them all in one place at one time: for all U.S.-based manufacturers that report their warranty expenses, claims were up by $1.38 billion, or 5.6%; accruals were up by $1.02 billion or 4.3%; and reserves were down by $977 million or 2.3%.
In terms of percentages of sales, manufacturers ended 2018 with their claims rate just above 1.3% and their accrual rate just below 1.3%. Both metrics have averaged just under 1.5% for the past 64 quarters, but were much higher a decade ago, suggesting that their cumulative cost-cutting has avoided tens of billions of dollars in expenses during the period.
Last year, the vehicle manufacturers saw their claims rise by $667 million, or 5.4%. The electronics manufacturers saw their claims fall by $32 million or 0.4%. And the building trades saw their claims soar by $745 million, or 19%. As a result, the overall share of claims reported by vehicle manufacturers crossed the 50% mark for the second year in a row, and the building trades accounted for a record 18% of the total in 2018. More to come in the weeks ahead.


