Top Chinese Automaker Warranty Expenses:
Claims jumped but accruals fell. Automotive revenue rose but unit sales declined. The warranty metrics of the top Chinese OEMs are puzzling, and the amount of accruals they each set aside per vehicle sold is impossibly low. Something is just not right with these numbers.
The Chinese passenger car market is simultaneously the world's largest, most competitive, and least understood. Therefore, before we attempt to calculate the amount the automakers spend worldwide on warranty, we have to figure out the metrics of the manufacturers based in China.
We began the warranty expense reporting process by taking a look at the English-language editions of the annual reports of all the top Chinese automakers. We found eight that publish annual reports. In three of them, we found full details about the amounts of claims paid, accruals made, and reserves held by the companies over the course of the year.
In one annual report, we found the beginning and ending balances in the warranty reserve fund along with figures for "provisions," which is another word for accruals made. Using eighth grade arithmetic, we solved the equation for claims paid (although it's entirely possible there were additional up-or-down adjustments that were not reported).
These four companies, plus four more automakers, also provided their annual sales revenue figures as well as unit sales figures. Some were also good about segmenting product and service revenue. All of course reported their sales in the Chinese national currency, the yuan, also known as the renminbi, and abbreviated as RMB. One yuan is equal to about 14-to-16 US cents, depending on the year in question. In other words, in round numbers, there are six-to-seven yuan per dollar, depending on the time period.
Using the sales, claims, and accrual data found in these annual reports, we were able to calculate two additional warranty metrics: claims as a percent of sales (the claims rate), and accruals as a percent of sales (the accrual rate). As we will show, most of these percentages were extraordinarily low, compared to the reports of American, Japanese, and European automakers we've detailed over the past few weeks.
Four Top Manufacturers
At the end of the day, we found multi-year warranty expense figures in the annual reports of four out of the top five China-based automakers. They are:
- SAIC, also known as SAIC Motor Corporation Ltd., formerly known as Shanghai Automotive Industry Corp., which also has joint ventures with General Motors and Volkswagen;
- Dongfeng, also known as Dongfeng Motor Group Company Ltd., or DFM, formerly known as Second Automotive Works, which also has joint ventures with Honda, Nissan, Kia, PSA and Renault;
- Changan, also known as the Chang'an Automobile (Group) Company Ltd., formerly known as the Shanghai Foreign Gun Bureau, and officially called the Chongqing Changan Automobile Company Ltd., which also has joint ventures with Ford, Mazda, PSA and Suzuki; and
- BAIC, also known as BAIC Motor Corporation Ltd., formerly known as the Beijing Automotive Industry Holding Company, which has joint ventures with Hyundai and Daimler.
The top-five Chinese automaker we could not find an annual report for is called the FAW Group Corp., formerly known as First Automobile Works. In fact, despite the government-owned company's fiscal year ending seven months ago, we couldn't even find an annual revenue or unit sales figure for the company. But they could be ranked as the third-largest OEM -- between Dongfeng and Changan -- if they ever get around to announcing how they're doing.
The four Chinese OEMs we are looking at in detail this week account for just over half the total market. Specifically, we estimate that over the past six years they have accounted for an average of 57% of the claims, 54% of the accruals, 58% of the reserves, and 55% of the sales revenue of all Chinese manufacturers combined.
However, all four are also engaged in joint ventures with German, French, Japanese, Korean, and American manufacturers. And this is where things get a bit tricky. Most cars sold in China are made in China. Imports are uncommon. But are we essentially double-counting the output of the joint ventures? In other words, if BAIC makes and sells a Mercedes-Benz vehicle in China, does Daimler also count it as a unit sale? And who ultimately pays the warranty claims?
Last October, we took made a first attempt to quantify the Chinese auto warranty business, in what had by then become the world's largest national auto market. However, by the end of 2018, it was clear that something that had never happened before in China was happening: the market was shrinking. According to industry reports, the annual unit sales volume fell by two percent in China last year -- the first annual decline in recent memory.
Warranty Claims Paid
According to our estimates, however, total Chinese claims costs were up by more than a third past year, surpassing 15.1 billion yuan. That's because while accruals usually remain proportional to sales, there's always a lag time between when a vehicle is sold and when it needs warranty work. So even though new car sales might have peaked, the warranty claims for cars sold in 2017 and before are now coming due.
The four OEMs we're looking at in detail accounted for about 7.15 billion yuan in claims last year, up by 1.42 billion yuan or 25%. That means the dozen or so other OEMs in the market but not in this chart saw their claims cost rise significantly faster than these four did.
In Figure 1, moreover, it's clear that for SAIC in particular, claims costs were higher in past years than they were in 2018. However, because SAIC's claims dipped in 2016 and 2017, the size of the increase last year was 1.34 billion yuan or more than 44%.
Figure 1
Top Chinese Auto Manufacturers
Claims Paid per Year
(in millions of yuan, 2013-2018)
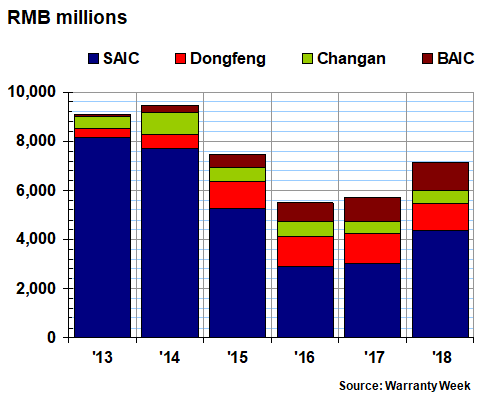
Claims cost actually fell for Dongfeng and Changan last year -- by 10% for the former and by less than one percent for the latter. Meanwhile, claims rise by 194 billion yuan or nearly 20% for BAIC.
Claims Rate
As a percentage of sales, however, all four Chinese OEMs saw their claims rates rise slightly from 2017 to 2018. Dongfeng rose from 1.0% to 1.1%. BAIC rose from 0.7% to 0.8%. Changan rose from 0.7% to 0.8%, but as can be seen in the chart below, its claims rate rose from just under BAIC's rate in 2017 to just above it in 2018. The low man on the chart, for the third year in a row, was SAIC. Back in 2013, it had the highest claims rate of the four.
Figure 2
Top Chinese Auto Manufacturers
Warranty Claims Rates
(as a percentage of sales, 2013-2018)
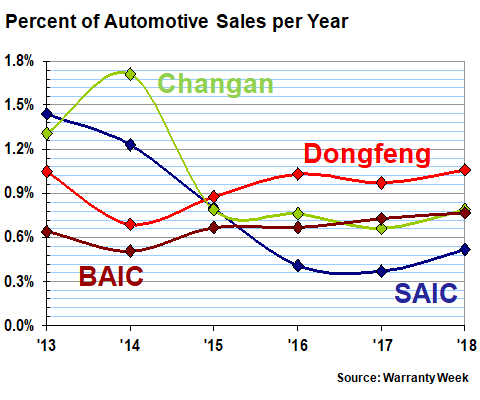
We should again note that most of these claims rates are very low, compared to Japanese, European, and American car companies. The average claims rate of all four OEMs over six years is only 0.9%. In contrast, Nissan's average claims rate is just over one percent, and Hyundai's is over two percent. Volkswagen's claims rate nearly hit nine percent in 2017.
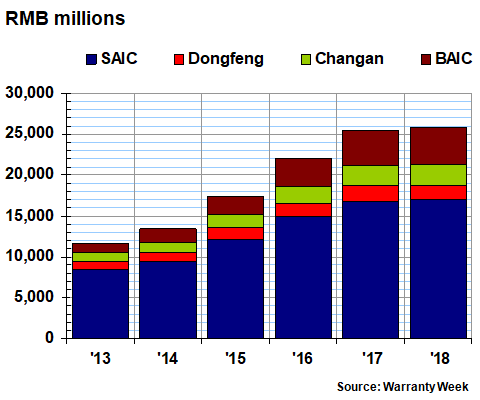
Warranty Accruals Made
It's quite the opposite story with warranty accruals. As can be seen in Figure 3, accruals fell for all four Chinese OEMs in 2018, from 8.9 billion yuan to 7.3 billion yuan. And while accruals fell 18% last year for this group, we estimate that accruals actually rose slightly for many of their competitors, so accruals for all Chinese OEMs fell by only nine percent last year, to just over 15 billion yuan.
Figure 3
Top Chinese Auto Manufacturers
Accruals Made per Year
(in millions of yuan, 2013-2018)
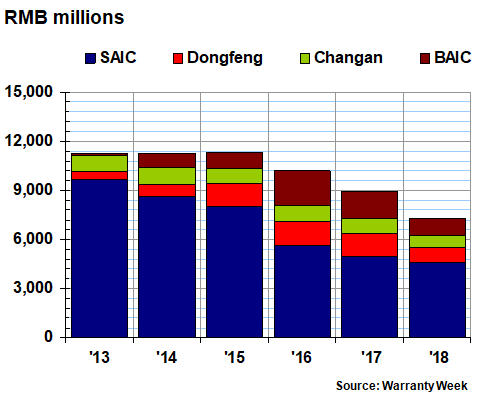
Though the group's total accruals look the same for 2013, 2014, and 2015, there were actually slight increases each year. But since that 2015 peak (for this group), accruals have fallen each year by double-digit percentages. BAIC cut its accruals by 33% last year; Dongfeng cut its accruals by 30%; and Changan cut its accruals by 24%. The relative size of SAIC's accrual reduction was only 8%, but that's understandable given that claims rose dramatically.
Accrual Rate
Within this group, SAIC has the lowest claims rate and the lowest accrual rate for three years in a row. However, before touting this in press releases and television advertisements, please note that we are very uncertain about the composition of what these manufacturers call their provisions and usage of warranty reserves, and we also worry that the warranty expense accounting methodology of their joint ventures is not fully detailed in their annual reports.
We have a feeling that while the Chinese OEMs each paid the warranty expenses for their self-owned brands, some of them ultimately paid only some of the claims for some of the vehicles they sold through joint ventures with the foreign manufacturers. That's not explicitly stated in the annual reports, but it would explain why the Chinese OEMs have by far the lowest warranty expense rates in the world. They might be reporting all of the revenues for all the vehicles they sell, but only some of the warranty expenses generated by their joint ventures.
That being said, SAIC's accrual rate was the lowest of the four at 0.5% last year, while BAIC's was at 0.7%. Dongfeng's was at 1.0%, and Changan's was at 1.1%. All four companies saw declines from 2017 to 2018, and Changan and SAIC have seen declines in each of the past five years. And interestingly, for all four companies, these latest percentages were the lowest readings of the last six years (Dongfeng's accrual rate was fractionally lower in 2018 than it was in 2014).
Figure 4
Top Chinese Auto Manufacturers
Warranty Accrual Rates
(as a percentage of sales, 2013-2018)
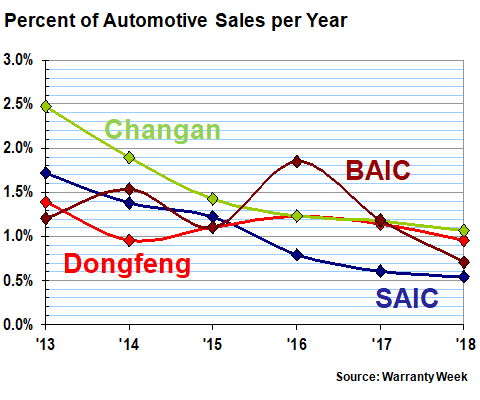
Note that the accrual rate is calculated by dividing accruals made by sales revenue. We've already noted that both the accrual rate and the amount of accruals made decreased for all four companies from 2017 to 2018. Sales revenue also declined for Dongfeng and Changan. However, sales revenue rose for both SAIC and BAIC (by 3% and 13%, respectively.
The reason we mention this is because the Chinese auto market fell by two percent in terms of units sold, according to industry estimates. But we estimate that sales revenue actually rose by 3% overall, which implies an increase in unit prices. But we're still waiting for official revenue figures from a handful of companies, so this estimate could change.
Accruals per Units Sold
What we can't reconcile is what the data is telling us about the amount of accruals made per vehicle sold. As was mentioned, for at least these four companies, we have good data on units sold and accruals made. Yet when we divide one by the other, we get an assortment of figures for accruals per unit that strains credulity: 123 to 1,900 yuan per vehicle. For those playing along at home, that's only US$19 to US$294 per unit.
And that's just the range in 2013. In 2018, none of the four accrued more than US$100 per vehicle sold. Therefore, there must be some hidden defect in this metric, because none of those figures make any sense. Worldwide, the averages are much higher. In the U.S., automakers currently accrue about $400 per vehicle sold. In Japan, the average is closer to $500. And in Europe, it's almost $1,000, though this figure is heavily skewed by the situation at Volkswagen.
In the 16 years that automakers have been including warranty expense data in their annual reports, none outside of China have ever accrued less than US$100 per vehicle sold, except for Tata Motors from 2003 to 2006. And that occurred only in the years before Tata acquired Jaguar Land Rover from Ford. The year it made that acquisition, Tata's accruals rose to $133 per vehicle, and in 2008 that metric jumped to nearly $700 per vehicle. It has yet to drop back below even $500 per vehicle sold.
Therefore, we are not even going to include an accrual per unit sold chart for these four Chinese manufacturers, until we can find out how and why they could be so unbelievably low. For instance, last year Changan reported 713 million yuan in accruals and 2.1 million units sold. That works out to only US$37 per vehicle, using last year's exchange rate of 6.6 yuan to the dollar. Its accrual rate, meanwhile was only 1.1% of revenue. With metrics like that, one might assume that Changan makes the best cars in the world.
Besides an incomplete understanding of the way joint venture warranty expenses are reported by Chinese automakers, the other suggestion for how and why these figures could be so low is a misunderstanding of the Chinese numbering system. European and American companies usually report their figures in thousands or millions. But some Chinese companies report some of their figures in myriads, which are units of ten thousand. So a number such as 28.8 million might be written as 2880 myriads.
It's not as unlikely as it sounds. For instance, most Indian companies report their financial figures in units of 100,000 (a lakh) or ten million (a crore), rather than in thousands or millions. That's created problems for us in the past when trying to translate the warranty expenses of companies such as Tata and Mahindra into U.S. dollars. After a decade of trying, however, along with some expert coaching from some of our subscribers, we've mastered that task. But is it possible we're still off by a factor of 100 with our Chinese data retrievals?
Unit Sales
So that readers can get the full picture, in Figure 5 we're charting the unit sales totals for these four companies, as reported by the companies themselves. For these four companies, unit sales declined from 16.1 million vehicles in 2017 to 15.1 million vehicles in 2018, while in the wider market sales declined from 27.6 to 27.0 million units, according to the carsalesbase.com website.
Using that website's annual sales figures, and subtracting what we knew from the annual reports of the the four OEMs, we were able to include an estimate for the balance of the Chinese market in this chart. And we were able to estimate that the sales data we've harvested from the annual reports of these four companies accounts for 55% to 62% of the total units made and sold across the country, depending upon the year.
Figure 5
Top Chinese Auto Manufacturers
Vehicles Sold per Year
(in millions, 2013-2018)
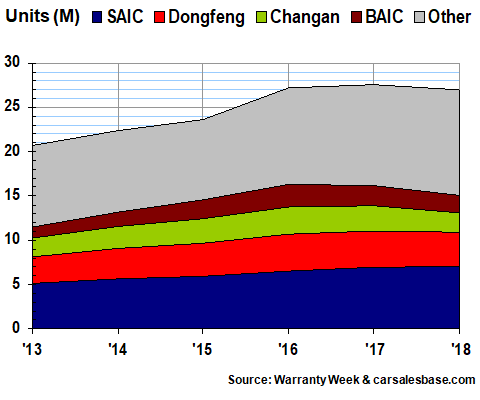
It does not appear than any of these figures are off by a factor of 100. And the data in Figure 3 also seems to be in order. So why would dividing one metric by the other produce such unlikely results?
Warranty Reserves Held
Our final metric is the balance left in the warranty reserve funds of these four companies at the end of each year. Again, these are taken from the annual reports. And actually, each year three or four other Chinese OEMs also announce their warranty reserve balances. So we estimate that all Chinese automakers together carried 46.7 billion yuan in reserves at the end of 2018, of which about 55% is represented by these four companies.
Figure 6
Top Chinese Auto Manufacturers
Reserves Held At Year's End
(in millions of yuan, 2013-2018)
SAIC, the largest company among the four, is all by itself carrying 17 billion yuan in reserves. That's up by about one percent from year-ending 2017 levels. And that's also in excess of US$2.5 billion. Only four American manufacturers carried more warranty reserves last year: Apple, Ford, GM, and GE. Worldwide, Nissan carried slightly less, and Kia carried slightly more.
In other words, SAIC is now a top-ranking manufacturer on a worldwide scale. In contrast, none of the other Chinese automakers would make it into the top 20 worldwide (though FAW might, if only it would report its warranty metrics).
Meanwhile, Changan raised its reserve balance by 7.7% last year, while BAIC raised its reserves by 2.3%. Dongfeng cut its balance by 108 million yuan, or 5.8%. And the four companies together saw a slight increase of 1.4% in their combined balances, bringing their total just above 25.8 billion yuan (US$3.9 billion).
This means that for these four Chinese companies, claims jumped by 25% last year, yet accruals fell by 18%. Total revenue rose slightly, but units sold declined slightly. And reserves grew by 1.4%.