Top Asian Automaker Warranty Expenses:
The recent trend has been upward for the warranty metrics of these Korean and Indian car companies, with some of their expenses setting new record highs. Their warranty costs are far from out of control, but they're no longer low, which is bad for companies known for their lengthy warranties.
We began by taking a look at the warranty metrics in the last ten annual reports of two Korean and one Indian auto manufacturer: Hyundai Motor Company, Kia Motors Corp., and Tata Motors Ltd. From each annual report, we gathered three essential warranty metrics: the amount of claims paid per year, the amount of accruals made per year, and the amount of warranty reserves held at the end of each year.
We also gathered data on how many vehicles each company sold, and how much revenue these sales generated. Using the claims, accrual, and revenue data, we calculated ratios for claims as a percent of sales, and accruals as a percent of sales. Using the accrual and unit sales data, we also calculated how much each company accrued per vehicle sold.
Because two companies use the Korean won and one uses the Indian rupee, we had to convert all the figures to U.S. dollars in order to include them on the same charts. There are about a thousand won per dollar and about 69 rupees per dollar. Also, Tata follows the Japanese custom of ending the fiscal year on March 31. So we had to time-shift that data back by three months so it lined up with the calendar format of Hyundai and Kia. In other words, in the charts below, the data from Tata's fiscal year ended March 31, 2019 is listed in the 2018 column.
Warranty Claims
In Figure 1, we are listing the total amounts of claims paid per year by each of the three manufacturers. Last year, Hyundai paid the equivalent of $1.66 billion in claims, while Kia paid $1.43 billion and Tata paid $1.24 billion. All three saw increases from the year before: slight increases for Hyundai and Kia but a 23% jump for Tata.
Figure 1
Top Asian Auto Manufacturers
Claims Paid per Year
(in millions of US dollars, 2009-2018)
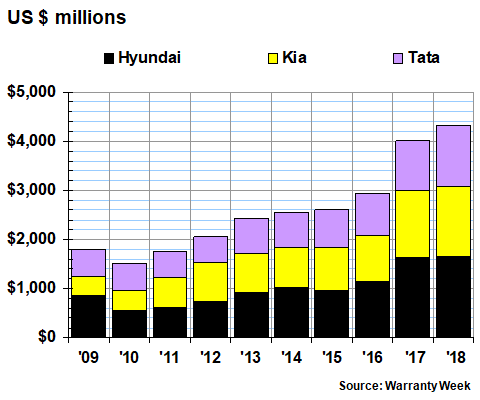
The increases for the Korean companies were far more severe from 2016 to 2017. During that interval, Hyundai's claims cost rose by more than $500 million, and Kia's rose by more than $400 million. Tata's claims cost also rose, but by a comparatively smaller $143 million to just over $1 billion for the first time.
Indian Numbering System
We should note that many of the financial figures in the Tata annual reports follow the Indian numbering system, which is slightly different from the one used by most European and American companies.
In India, a lakh is a unit of one hundred thousand, while a crore is a unit of ten million. These are used in financial statements instead of millions and billions. They are also written differently. In Europe and America, commas are inserted after the thousands, millions, and billions, as in 1,000,000,000, or one billion. But in India, commas are inserted after the thousand, lakh, and crore, as in 100,00,00,000, or a hundred crores, and as in 10,00,000, or ten lakhs.
Therefore, a hundred crores is equal to one billion, and ten lakhs is the same as one million. So when a company reports its sales as 2141 crore rupees, it would be the same as 21.41 billion rupees -- basically, move the decimal point two places to the left and change the units from crore to billions. And 21.41 lakh would be 2.141 million -- move the decimal one place to the left and swap the unit labels.
Claims Rates
The good news is that the currencies drop out of the equations when calculating the claims rates. These are expressed as a percentage of automotive product sales (total revenue minus service revenue and investment income). And while the data in Figure 1 is also subject to the relative rises and falls of the rupee, won and dollar, in Figure 2 the same currency is divided by itself.
Note that the claims rates rose for all three manufacturers last year -- by an imperceptibly small amount at Hyundai, but by a tenth of a percentage point at Kia, and by more than 0.6% at Tata. And more importantly, the 2018 figures were was the highest reading for all three companies over the last decade.
Figure 2
Top Asian Auto Manufacturers
Warranty Claims Rates
(as a percentage of sales, 2009-2018)
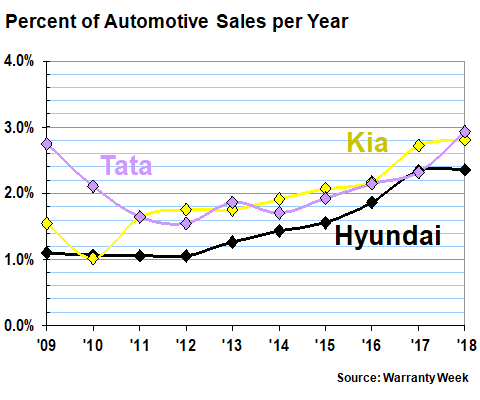
Hyundai and Kia saw far more severe increases in their claims rates from 2016 to 2017. During that interval, it was up by nearly 0.5% at Hyundai and nearly 0.6% at Kia. And as a result, in 2017 Tata had the lowest claims rate of the three by a tiny margin. By 2018, it had the highest, however.
It is dangerous to make direct comparisons of the warranty metrics of different companies, in different countries, using different currencies, however. We have no assurances that each company counts claims costs in exactly the same way. For instance, one company could include recall costs while another counts those separately from warranty (but almost all now count them together). Or they could price parts differently: full retail, aftermarket, replacement cost, wholesale cost, etc.
However, it is completely valid to compare one manufacturer to itself over time. Therefore, it is accurate to note that claims costs have been rising for most of the past decade for each of these manufacturers. Each is now well above their decade-long average, and as was mentioned, each is at the top of their decade-long range. Three percent isn't out of control, but it is higher than it's been.
Warranty Accrual Totals
In Figure 3 we are charting the accrual totals for each of the three companies over the past ten years. Once again, the totals for all three together are at a record high, but unlike with claims, Kia's total was much lower in 2018 than it was in 2017. Kia's accruals fell by $420 million in 2018, and was slightly smaller last year than it was in 2016. But both Hyundai and Tata hit a new record high.
Figure 3
Top Asian Auto Manufacturers
Accruals Made per Year
(in millions of US dollars, 2009-2018)

Interestingly, the accruals of the three companies last year were all very close to $1.5 billion. Back in 2017, Tata and Hyundai were closer to $1.3 billion, while Kia was closer to $1.9 billion. And then Hyundai increased its accruals by 22% while Kia reduced its accruals by 22%. As a group, accruals rose by $69 million, or only 1.5%.
Accrual Rates
Perhaps the most revealing statistic is the accrual rate, which is calculated by dividing the amount of accruals by the amount of sales revenue. Since accruals are made at the time of sale, it reveals each company's expectation of the future cost of warranty.
In Figure 4, it is clear that the trend for all three companies is towards increasing costs, although Kia's accrual rate was higher in both 2016 and 2017 than it was in 2018. But both Tata and Hyundai hit new highs in 2018.
Figure 4
Top Asian Auto Manufacturers
Warranty Accrual Rates
(as a percentage of sales, 2009-2018)
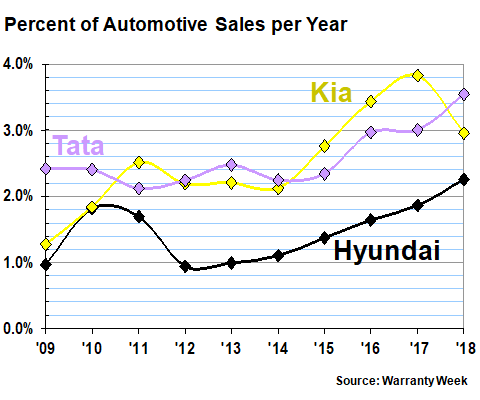
Over each of the past ten years, Hyundai has had the lowest accrual rate of the group. In six of the ten years, Tata was highest. But in 2011, and again from 2015 to 2017, Kia had the highest accrual rate. And at 3.8%, Kia's 2017 accrual rate was the highest of all, at least within the last decade.
Accruals per Unit Sold
In Figure 5, we're taking the same data for accruals, but instead of recalculating it as a percentage of revenue, we're using unit sales data to calculate the amount of accruals made per car sold. The trends are roughly similar, but the product lines are different. So, for instance, Tata's sales are dominated by luxury Jaguar and Land Rover models. Therefore, the sales price is higher, and so are the accruals per unit sold.
Figure 5
Top Asian Auto Manufacturers
Accruals Made per Vehicle Sold
(in US dollars, 2009-2018)
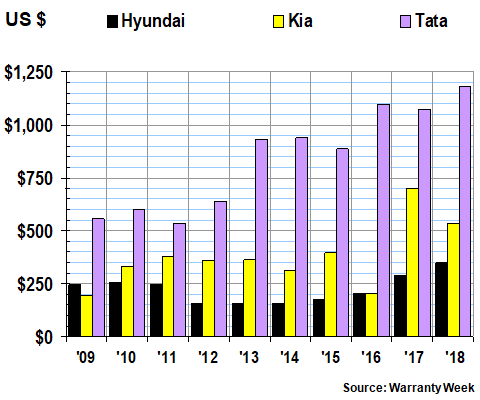
Last year, Tata accrued the equivalent of $1,180 per unit sold. But since those units were selling at an average price above $33,000 per unit, it worked out to 3.5% of revenue. In contrast, Kia accrued only $530 per unit sold, but those units averaged $18,000 each, so its accrual rate was just under three percent.
Note that although out of these three companies, Hyundai had the lowest accrual rate as well as the lowest accruals per unit, the 2018 reading for both metrics was the highest of the past ten years. Tata also had the highest reading for both metrics last year. But Kia peaked in 2017.
Warranty Reserves
Our last metric is the balance in the warranty reserve fund reported for the end of each company's past ten fiscal years. In Figure 6, it's clear that Hyundai alone accounted for far more of the group's total reserves (45%) than it did of either their claims (38%) or accruals (35%) last year.
However, that 45% was the lowest share it had of the total for the past decade. Back in 2009, Hyundai accounted for almost three-quarters of the total, and as recently as 2014 it accounted for 60%. So to be precise, Hyundai's share of the total has been slowly decreasing for ten years, and fell to 45% last year.
Figure 6
Top Asian Auto Manufacturers
Reserves Held At Year's End
(in millions of US dollars, 2009-2018)
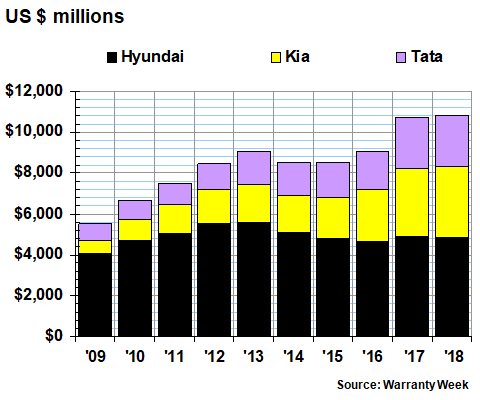
Hyundai's reserve balance fell by a little less than one percent last year, while Kia's and Tata's both grew. And both set new records: Kia at $3.45 billion and Tata at $2.53 billion. Together, they held 55% of a $10.8 billion pie -- more than ever before in both dollar terms and as a percent of the total.
In terms of worldwide auto warranty expenses, these are the last pieces of the puzzle we need to form a global estimate. On a worldwide basis, when all is converted into U.S. dollars, Hyundai, Kia, and Tata are OEMs number 9, 10, and 11, respectively -- spending a little less than Honda (#8) and a little more than Nissan (#12) on warranty claims in 2018.
We now have reliable warranty expense reports for 24 OEMs, and estimates for 11 more, comprising a data set for what we believe is all but a small portion of the worldwide passenger car industry. But we'll leave the specifics to next week's newsletter, when we will bring together the American, European, Chinese, Japanese, Korean, and Indian warranty data we've compiled over the past month to form a worldwide set of charts for warranty expenses in the passenger car and light truck industry over the past decade.