

U.S. Consumer Vehicle Makers:
The nine-month financial reports suggest that the top U.S.-based passenger car, motorcycle and recreational vehicle makers have seen a slight increase in their warranty costs and a slight decrease in sales, resulting in an upturn in their claims rates. But it's nothing like what happened to them a decade ago, when sales plunged by unprecedented amounts and claims costs didn't.
The warranty expense patterns of vehicles manufactured for sale to U.S. consumers are showing none of the signs of doom they did 11 years ago, when the Great Recession began to take hold. Now that the third quarter financial statements and the warranty expense reports they contain have been published for investors, we took a look at the claims costs of eight of the top U.S.-based consumer vehicle makers, and found little to suggest a repetition of the 2008-2009 financial crisis is imminent.
We included top representatives from each segment of the vehicle market. For traditional sedans, SUVs, and pickup trucks, we included the Ford Motor Company and General Motors Co. For electric cars, we included Tesla Inc. For motorcycles, we included Harley-Davidson Inc. and Polaris Inc. (which also makes snowmobiles and ATVs). And for recreational vehicles, we included Thor Industries Inc., Winnebago Industries Inc., and Rev Group Inc. (a new company formed from the remnants of Fleetwood Enterprises and the RV assets of Navistar, among others).
For each of those eight companies we gathered two essential metrics from their financial statements: the amount of warranty claims paid, and the amount of warranted products sold (total sales minus service, finance, licensing, and other non-hardware sources of revenue). And then by dividing one metric by the other, we calculated the percentage of product revenue that was being spent on warranty claims.
For six of the companies, we were able to collect 67 measurements of each metric for all the quarters since the start of 2003. For Tesla, the metrics stretch back to 2009, and for Rev Group, back to 2016.
What the data shows is that while the events of 2008 and 2009 left a distinct mark on the metrics, there is none of that evident now. Yes, sales are down (for all but Polaris and Rev Group), but only by single digits compared to 2018. But claims (for all but Polaris) are up for both the third quarter and the first nine months of 2019 (compared to the same period in 2018).
Car Manufacturers
Way back in the dark ages of 2009, the U.S. Treasury Department's Troubled Asset Relief Program (TARP) had to step in to guarantee the factory warranties of GM and Chrysler, launching the Auto Warranty Commitment Program. The U.S. government lent the automakers tens of billions of dollars to keep the doors open. GM and Chrysler filed for bankruptcy, and Chrysler was eventually sold to Fiat. It was the worst year for the automotive industry since at least 1983, if not ever. And it's one the industry would hope we forget.
We're very far away from that point now. The industry is down from its peak, but it's not falling apart. Ford's product sales for the first nine months of 2019 were down 2.8%. GM's third quarter product sales were down 1.4% from the previous year. Tesla's product sales were down by 5.9%. But that's a slowdown. In 2008-2009 it was a free-fall, and had it not been for the government loans, there would have been no parachute.
Let's look at the top U.S.-based automobile manufacturers (Chrysler does not report its warranty expenses quarterly, and no longer reports separately from Fiat). In Figure 1, it looks as if GM is holding steady while Ford is up a bit. In exact numbers, GM's warranty expense was up $39 million or 1.8% for the first nine months of 2019, while Ford's was up $288 million or 9.3%.
Figure 1
Automotive OEM Warranties
Claims Paid by U.S.-based Companies
(in US$ millions, 2003-2019)
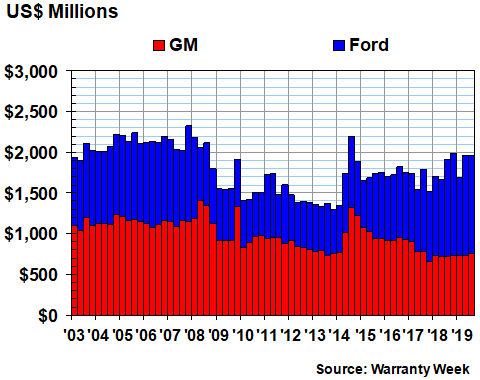
Note that since the middle of 2017, Ford has been paying more in claims than GM, something that happened only once in the 58 quarters before that (in the final quarter of 2007). Also note that for both companies, the quarterly claims cost began a slow but steady decline in 2008, a trend which did not reverse itself until the recalls spiked in 2014.
In Figure 2, we have taken the claims cost data from Figure 1 and divided it by the corresponding sales data to calculate the claims rate for each company. Note that Ford's claims rate has been higher than GM's for the last eight consecutive quarters and for nine of the past 11, something that had happened previously only in 2006 and 2007.
Figure 2
U.S. Auto Manufacturers
Average Warranty Claims Rates
(as a % of product sales, 2003-2019)
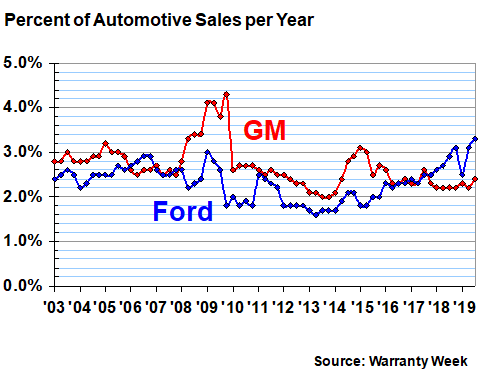
But also note the recessionary spike in the 2008 and 2009 data, as sales fell fast but claims fell slowly. At some points during this period, GM was spending more than four percent of its product revenue on warranty claims. In all other years, it barely exceeded three percent.
Long term, Ford's claims rate has averaged 2.3% (with a standard deviation of 0.4%), while GM's has averaged 2.7% (with a standard deviation of 0.5%). But for the past two years, GM has been lower.
Small Vehicle Manufacturers
Next, we will take a look at two motorcycle manufacturers as well as an electric car manufacturer. Tesla, of course, makes full-size sedans and will soon make on-highway trucks (as well as pickup trucks), so it competes more directly with GM and Ford. But its warranty expenses are so much smaller than theirs that it would barely show up.
In this group, however, it dominates. In fact, in each of the past four quarters, Tesla's claims costs have exceeded those of Harley and Polaris combined. Harley was for many years the largest claims-payer of the three, until Polaris ran into some recall trouble in more recent years. But Tesla has now passed them both.
Figure 3
Light Vehicle OEM Warranties
Claims Paid by U.S.-based Companies
(in US$ millions, 2003-2019)

For the first nine months of 2019, Tesla's claims costs are up $26 million or 18%, while Harley's are up $13 million or 22%. Polaris is the outlier, with its claims costs down by $7.3 million or 7.6% for the first three-quarters of the current year. Looking at just the third quarter of 2019, and comparing it to the third quarter of 2018, Tesla's claims costs are up 9.1%, Harley's are up 25%, and Polaris' are down 23%.
In Figure 4, the most unusual aspect of the claims rate chart for these three companies is how massive the seasonal highs and lows were for Polaris in the previous decade. Every year, the claims rate peaked during the first quarter and bottomed out in the third quarter. That had more to do with highly-variable sales patterns than with claims cost, however, as a look back at Figure 3 will verify.
Figure 4
U.S. Light Vehicle Manufacturers
Average Warranty Claims Rates
(as a % of product sales, 2003-2019)
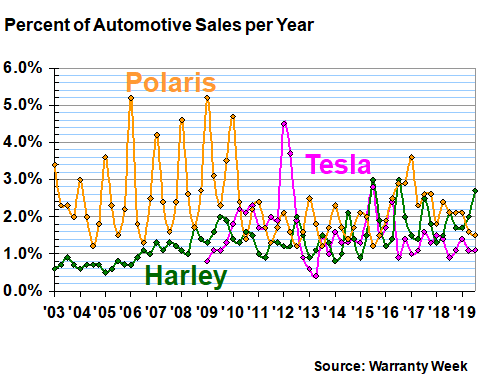
Motorcycles also show a seasonal pattern, but not to such an exaggerated extent. For Harley-Davidson, the claims rate peaks during the third quarter, and bottoms out during either the first or second quarter of each year. However, that also has more to do with sales than with claims. In fact, claims are frequently highest during the fourth quarter, but so are sales.
Over time, Harley has had the most stable and lowest claims rate of the group. Harley's long-term average claims rate has been 1.3%, with a standard deviation of 0.6%. Tesla's claims rate has averaged 1.6% since 2009, with an 0.8% standard deviation. Polaris has been the highest and the most variable, with a 2.3% average and an 0.9% standard deviation.
Recreational Vehicle Makers
Our last group of consumer vehicle makers are three of the surviving RV manufacturers. And these really are the survivors. The Great Recession hit both the automobile and new home industries very hard, but it hit the RV segment even harder. RV sales virtually stopped, and many of the top manufacturers went into liquidation, taking their warranties with them to the bottom. It was so bad at times that some RV dealers were giving away "free" extended warranties (where they paid the premiums on behalf of consumers) just to move the orphaned inventory off their lots.
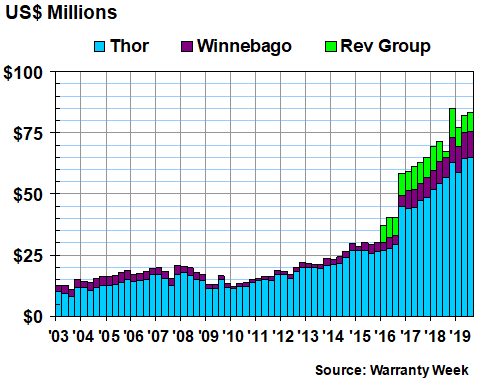
Thor, and more recently Rev Group, bought and revived many of those bankrupt nameplates. And as can be seen in Figure 5 below, Thor's claims cost dipped a bit in 2009 and 2010 but has been growing ever since (for more on the free-fall of the bankrupt companies, see the "other" segment of Figure 1 in the August 9, 2018 newsletter.)
Figure 5
Recreational Vehicle OEM Warranties
Claims Paid by U.S.-based Companies
(in US$ millions, 2003-2019)
At this scale it's hard to see how far and how fast Winnebago's claims costs fell. But as an example, it paid $3.7 million in claims during the final quarter of 2007 but only $1.0 million in the first quarter of 2010. Sales fell precipitously.
In Figure 6, the effect is easy to see. During 2008 and 2009 Winnebago's claims rate spiked as high as 3.8% and Thor's rose all the way to 5.0%, as sales virtually came to a halt but claims continued to be paid. Somewhat ominously, Thor's claims rate rose to 4.6% earlier in 2019, but has fallen back into the "normal" range for the rest of this year so far.
Figure 6
U.S. RV Manufacturers
Average Warranty Claims Rates
(as a % of product sales, 2003-2019)
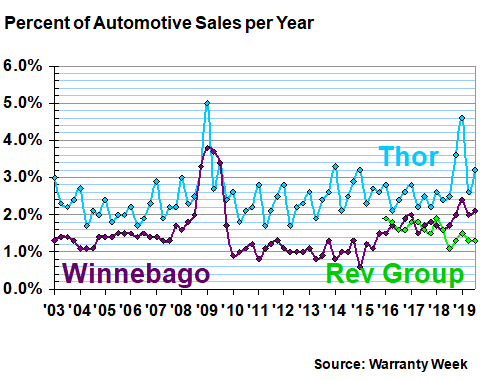
Winnebago's claims rate has generally been rising for the past five years, ever since bottoming out at 0.6% in early 2015. Long term, its claims rate has averaged 1.5% with an 0.6% standard deviation. Thor's average has been much higher, at 2.6%, but its standard deviation has been the same at 0.6%. And the Rev Group, which only began reporting in 2016, has averaged 1.6% with only an 0.2% standard deviation.
Rev Group is also the only one of the three to see sales increases recently. For the first nine months of 2019, its product sales are up 1.7%. Winnebago's sales were down 1.5% for the fiscal year that ended on August 31, while Thor's sales were down 5.6% for a fiscal year that ended on July 31.
Slowdown, Not Meltdown
So once again, what we're seeing is a slowdown, not a free-fall. It more a reminder of how good things were in 2016 and 2017, now that sales in 2018 and 2019 are down somewhat from those peak years. But it's nothing like the downturn that followed the "good old days" of 2006 and 2007 a decade ago. Whether it's passenger cars, motorcycles, or RVs, that was a time when corporate survival, let alone prosperity, was far from certain.


