Warranty Claims & Reserves, Part 1:
Using three metrics: claims, reserves, and sales, we can calculate which industries and even which individual companies are over or under the averages for both their spending on claims and the capacity of their reserve funds. And by charting the results, we can see which companies, industries or manufacturing sectors have the most consistent warranty expenses.
Imagine, as unlikely as it sounds, a company stopped selling products one day. Would the amount they have in their warranty reserve fund prove to be enough to pay off all claims until the last product warranty expired? Or are the amounts added into the fund purposefully less than needed?
In the last few weeks, we've presented the warranty expense totals and averages of all the U.S.-based manufacturers, dividing them into three groups: vehicle makers, electronics manufacturers, and companies engaged in the building trades. What we've noticed is that of all the data and statistics, the claims and warranty reserves totals and averages seem to be the most stable and least volatile metrics, while the accrual data seems to be the most irregular.
Accrual totals, we suspect, are subject to manipulation. For instance, some vehicle manufacturers consistently keep their accrual rates half a point lower than their claims rates, making up for the inevitable shortfall through periodic "one-time adjustments" that Wall Street analysts usually overlook when making their beat-or-miss pronouncements. In the electronics sector, some manufacturers stuff their largest accruals of the year into the fourth calendar quarter, making the rest of the year look better in comparison. And in the building trades, some homebuilders sporadically make no accrual payments in a given quarter, as if the actuaries said every house they built was perfect.
What we're really seeing in these questionable actions is an effort to manipulate earnings that's hard to detect and impossible to prove in an era where facts don't seem to matter. So while we won't ignore the accrual data, from now on we will emphasize the claims and reserve data instead.
Warranty Reserve Capacity to Pay Claims
What we're doing this week is taking 67 quarterly measurements of three metrics. From each company that reports warranty expenses, we're collecting the amount of claims paid per quarter, the amount of warranty reserves held at the end of each quarter, and the amount of product sales revenue reported each quarter.
We're then dividing the claims data by the sales data, to calculate the percentage of sales that's going towards warranty costs. And we're also figuring out how much a company is paying in claims each month, because then we're dividing their warranty reserve balance by that amount. The result is how long, in months, the warranty reserves would last given the current rate of spending.
In other words, if a company reports $3 million in claims paid per three-month quarter, $10 million in warranty reserves, and $100 million in sales, their claims rate would be $3m / $100m = 3.0%, and the capacity of their warranty reserve would be $10m / $1m = 10 months.
It turns out that over the past 17 years, the industry average has been 1.5% for the claims rate and 18 months for the reserve fund capacity. Each industry and sector is different, and would be above or below those averages. In fact, with 67 different measurements over the past 17 years, they could be both above and below the averages at different times.
Vehicle Makers
In Figure 1, we're looking at the track record of 232 U.S.-based manufacturers of cars, trucks, trains, airplanes, bikes, scooters, and other vehicles, and their suppliers. Over the long term, their claims rate has been a bit higher than average at 1.6%, and their warranty reserve capacity has been as well, at 22 months. However, over the past 67 quarters, their claims rate has frequently ended up below 1.5%, so it's to the left of the center. And there was one quarter (at the end of 2009) in which their reserve capacity actually fell below the 18-month all-industry average.
Figure 1
Vehicle Manufacturer Warranties
Claims Rate & Reserves Held by U.S.-based Companies
(as % of sales & months of coverage, 2003-2019)
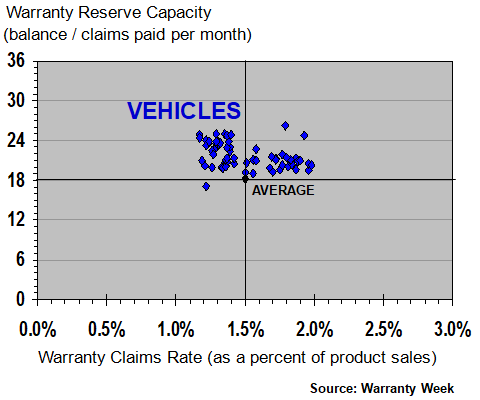
In effect, the warranty reserve capacity measures the adequacy of the reserve fund to pay all the claims that might someday be filed, for all the products already sold. If all of a given company's products get a three-year warranty, a good accounting practice would be to set aside enough money at the time of sale to finance 36 months of expected claims for that product. But then again, some warranties are nontransferable, and with vehicles, some will expire on mileage or usage rather than on time, and some will be wrecked beyond repair.
Also, the claims rate rises and falls depending on sales, so the ratio between claims and reserves could easily rise and fall between 17 and 26 months, as the data does in Figure 1. The idea is that a reader can look at the chart and quickly conclude that vehicles tend to have longer-than-average warranties and close-to-average claims rates.
Electronics Manufacturers
In Figure 2, we're tracking some 675 manufacturers of everything from computers and peripherals to semiconductors and printed circuit boards. And from a quick glance at the shape of the data below, it's clear that their products are covered by shorter-than-average warranties while their claims rates are still close to average. In fact, most of the data points suggest that they typically keep less than a year's worth of funds in their warranty reserves, while spending somewhere between one and two percent of their sales revenue on claims.
Figure 2
Electronics Manufacturer Warranties
Claims Rate & Reserves Held by U.S.-based Companies
(as % of sales & months of coverage, 2003-2019)
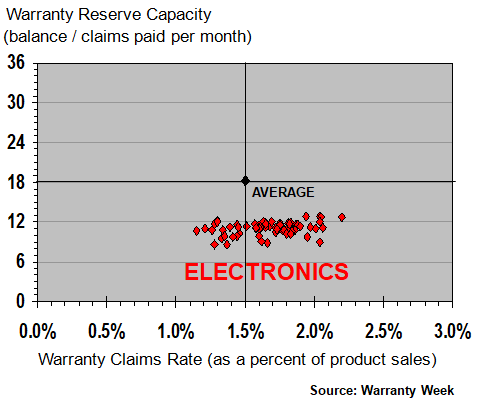
Long-term, the electronics manufacturers have spent an average of 1.7% of their product revenue on warranty claims, while keeping about 11 months of capacity in their warranty reserve funds. In other words, they're spending about $500 million a month on claims, or $1.5 billion per quarter, while keeping about $5.5 billion in warranty reserves on hand.
There is no right or wrong amount here. We're simply pointing out that the ratio between claims and reserves is much smaller for the electronics manufacturers than it is for the vehicle manufacturers. And this has been the case for all of the past 17 years, in all 67 of the quarterly measurements we have made so far (the fourth quarter 2019 data is beginning to arrive this week, however).
Building Trades
In Figure 3, we're looking at the building trades, a sector into which we've put everything from appliances and plumbing fixtures to the new homes themselves, along with all the furniture and building materials they contain. And from a quick look it appears that this sector's claims rates are significantly below average, while the capacity of their warranty reserve funds is at or above average.
Figure 3
Building Trades Warranties
Claims Rate & Reserves Held by U.S.-based Companies
(as % of sales & months of coverage, 2003-2019)
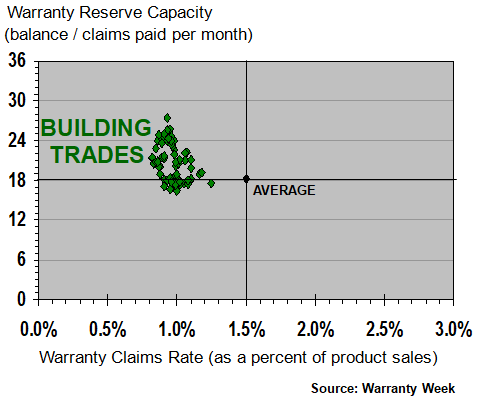
Over the long term, this group of roughly 350 companies has averaged just under a one percent claims rate, while keeping an average reserve capacity of 21 months. But again, this is an average of hundreds of companies over 67 quarters, so as they say in the car commercials, individual results may vary.
Readers may have noticed the Part 1 designation at the top of this newsletter. The reason is we have more data to present than will fit into one reasonable-length column. And while the above data may be nice to look at, it isn't directly applicable to any particular company's product line.
In an attempt to provide more relevancy, we will round out this Part 1 newsletter with snapshots for six specific product types. Four are in the automotive industry, and two are from the aerospace industry. In next week's newsletter, we will detail some of the electronics categories. And then on February 20 we will look at the building trades. By then, most of the year-end data should have arrived.
Carmakers and Their Suppliers
In Figure 4, we're looking at the manufacturers of passenger cars and other small vehicles, and many of their parts suppliers. In Figure 5, we're looking at truck, bus, and other large vehicle manufacturers, and the makers of drivetrain components such as engines and transmissions. And then in Figure 6 we're looking at the handful of U.S.-based plane manufacturers and their suppliers.
Figure 4
Passenger Car & Parts Manufacturer Warranties
Claims Rate & Reserves Held by U.S.-based Companies
(as % of sales & months of coverage, 2003-2019)
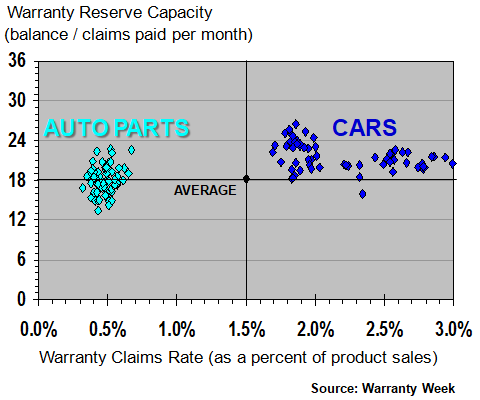
From a quick glance at Figure 4, it's clear that the makers of auto parts have a much lower claims rate than the OEMs they supply. It's also clear that while the auto parts makers always keep their claims rate close to their long-term average of 0.9%, the claims rates of the car manufacturers are spread widely from 1.7% to 3.0%. Yet they both keep similar reserve balances: 22 months for the carmakers and 18 months for their suppliers.
We also note that so far the data in the charts has been relatively flat, in that the ratio between reserves and claims -- measured along the vertical axis -- has not varied much between the highs and the lows. That's about to change.
Truck & Drivetrain Manufacturers
In Figure 5, we can see that over the past 67 quarters, the drivetrain manufacturers have allowed the ratio between their monthly claims costs and their warranty reserve balance to vary all the way from 18 to 35 months. The average is 27 months, but the standard deviation is 5.3 months. None of the previous charts contained data points with more than a 3-month standard deviation, and in fact the electronics standard deviation was below one month.
Figure 5
Truck & Drivetrain Manufacturer Warranties
Claims Rate & Reserves Held by U.S.-based Companies
(as % of sales & months of coverage, 2003-2019)
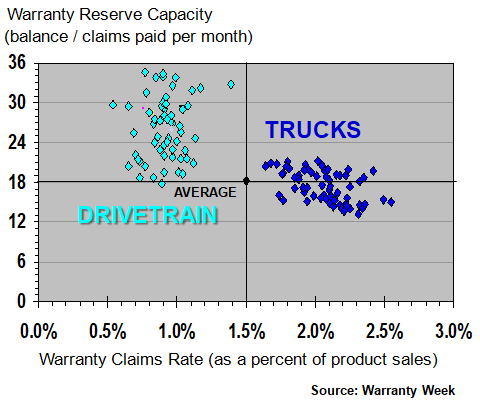
Secondarily, the truck and large vehicle data also shows a width-but-not-height pattern, as did the car and small vehicle data. However, the truck group's average claims rate is only 2.1% while the car group's average is 2.5%. The difference can be explained by the fact that the engines and transmissions for trucks are usually sold separately, with separate warranties, while the warranties of the carmakers are usually bumper-to-bumper. In other words, some of the truck warranty costs are shifted to the drivetrain group, while the carmakers have to fight it out with their suppliers.
Aerospace OEMs and Their Suppliers
In Figure 6, we're looking at the OEMs and the suppliers in the aerospace industry. We should note that this does not include most military sales, though some navy and air force customers are beginning to realize what a bad protection plan deal they're getting compared to civilian airlines and business jet buyers. The sad fact is that children's whirlybird drones have better warranties than most fighter jets.
Figure 6
Aerospace OEM & Supplier Warranties
Claims Rate & Reserves Held by U.S.-based Companies
(as % of sales & months of coverage, 2003-2019)
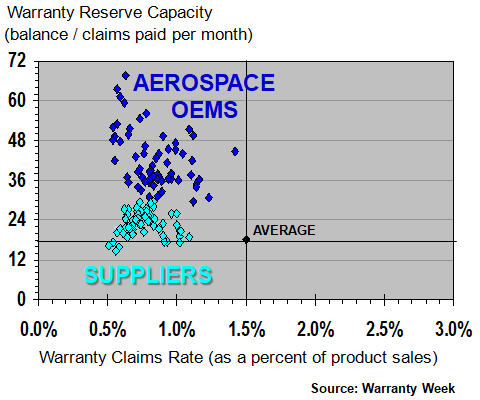
What immediately becomes apparent from a quick glance at this chart is that warranties in the civilian aerospace industry tend to be much longer than elsewhere. In response, the manufacturers keep far more than 18 months' worth of funds in their warranty reserve funds. The aerospace OEMs average 43 months, and their suppliers average 23 months. And it's also highly variable: the OEMs' reserve/claims ratio has an 11-month standard deviation.
Yet, at the same time, their claims rates are quite low. The OEMs average claims rate has been 0.9%, while their suppliers average 0.7%. In other words, compared to the all-industry average at the center of the chart, these groups have below-average claims rates and longer-than-average warranty terms. In fact, on several occasions in recent years the reserve capacity has risen above 60 months, or five years.
Of all the groupings included in this week's newsletter, the ones with the highest levels of stability and predictability are the ones that cluster in a small circle, like the holes in a marksman's target, as did the building trades or the auto parts manufacturers. The least consistent are those that are literally all over the place -- above and below average, left and right, like a cartridge of birdshot against a wall. The aerospace OEMs are a great example of how inconsistent and unpredictable these warranty metrics can be.