U.S. Auto Warranty Metrics:
In 2019, warranty metrics improved for Tesla and deteriorated for GM and Ford. While Tesla still sets aside the most funds per unit sold to finance future warranty costs, its current claims rate is one of the lowest in the business. And while GM and Ford spend less per vehicle, their vehicles also cost less, and their costs have been rising for several years in a row.
The 2019 annual reports are streaming in, with each company's warranty metrics tucked away in the notes towards the end. While we complete the task of extracting warranty data from them all and sorting it by industry, we wanted to take a quick look at one of the industry segments where warranty is prominent.
The passenger car industry is by far the largest source of warranty expenses, spending $46 billion on claims worldwide in 2018 (Warranty Week, Aug. 22, 2019). The U.S.-based car manufacturers accounted for only 16% of that total (we're counting Fiat Chrysler as a European manufacturer). However, the U.S.-based companies are also among the first to publish their 2019 annual reports. So while we're waiting for all the carmakers in Europe, China, India, Korea and Japan to release their annual numbers, let's look at the U.S. warranty metrics.
We began the process by extracting some key data from the newly-published 2019 annual reports of General Motors Co., Ford Motor Company, and Tesla Inc. In terms of warranty metrics, we gathered figures for claims paid, accruals made, and warranty reserves held. In terms of sales metrics, we gathered figures for worldwide unit sales and automotive sales revenue. And we used these metrics to calculate several ratios.
Using the claims and sales revenue figures, we calculated the percentage of revenue being spent on paying claims: the claims rate. Using the accrual and sales revenue figures, we calculated the percentage of revenue being put aside as accruals: the accrual rate.
Using the claims and warranty reserve data, we calculated the ratio between the reserve fund balance and the amount spent each month on claims. This gives us a reading of the capacity of the company's fund, in terms of how many months of claims-paying the balance represents.
Finally, using the accrual data and the unite sales data, we calculated how much each company was setting aside in accruals per vehicle sold, to finance warranty expenses expected in the future.
Total Claims Paid
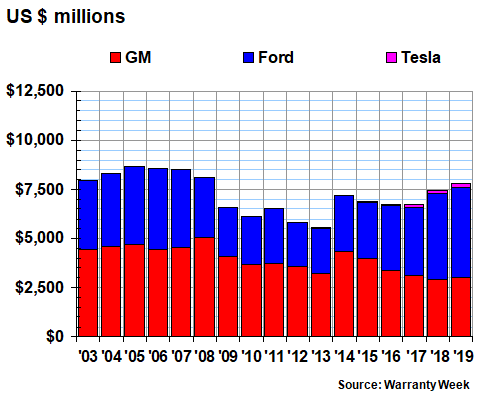
Let's begin with a simple reading of the amount of claims these three automakers paid per year for the past 17 years, or in the case of the relatively young Tesla, the amount paid for the past 11 years. In 2019, GM paid out just over $3 billion, up about 4% from 2018 levels. Ford paid out $4.56 billion, an increase of $201 million from 2018 levels. And Tesla paid out $250 million, a 20% increase from the year before.
Figure 1
American Auto Manufacturers
Claims Paid per Year
(in millions of dollars, 2003-2019)
Claims vs. Sales
The claims rate, defined as the ratio between claims and revenue, was adversely affected by both the increases in claims payments and the decreases in revenue (albeit an increase for Tesla). In Figure 2, we can see that the claims rate rose for all three companies in 2019, though by more for some than for others.
Figure 2
American Auto Manufacturers
Warranty Claims Rates
(as a percentage of sales, 2003-2019)
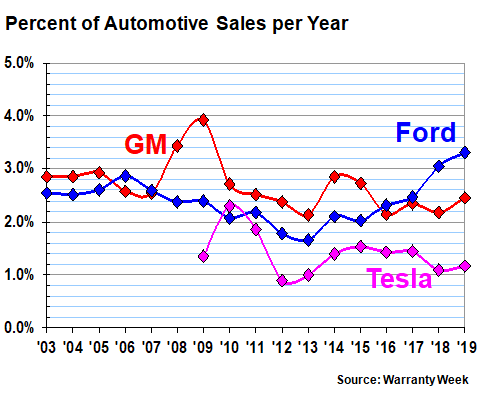
At GM, the claims rate rose from 2.2% at the end of 2018 to 2.5% at the end of 2019. At Ford, it rose from 3.1% to 3.5%. And at Tesla, it rose from 1.1% to 1.2%. Note that this is the highest-ever reading for Ford, surpassing 2018's and 2006's claims rates decisively. Also note that this is the ninth year in a row that Tesla's claims rate have been lower than both Ford's and GM's.
Claims vs. Reserves
In Figure 3, we're making use of all three warranty metrics: claims paid, accruals made, and reserves held. The horizontal axis tracks the ratio between accruals and sales, while the vertical axis tracks the ratio between reserves and claims. The units along the vertical express the number of months reserves would last at current levels of claims payments.
For Ford and GM, there are 68 data points apiece, representing the readings at the ends of the past 68 quarters, or 17 years. For Tesla, the data points begin in 2008. As is clear from the chart below, Ford's data points are among the lowest on both axes, while GM's are in the middle and Tesla's are highest.
Figure 3
American Auto Manufacturers
Claims Rate & Reserves Held by U.S.-based Companies
(as % of sales & months of coverage, 2003-2019)
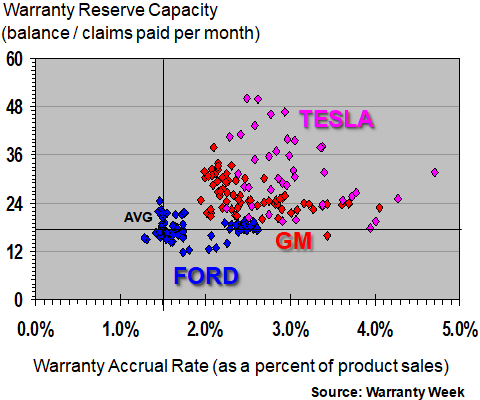
At the end of 2019, GM was spending about $266 per month on warranty claims, so its warranty reserve capacity stood at 29 months. Ford was paying about $389 million a month in claims, so its capacity was around 15 months. Tesla was paying about $25 million per month, so its warranty reserve capacity was up around 43 months.
Among all manufacturers in all industries, the historical average has been around 18 months over the past 17 years. So Ford has been the closest to average over time, though its warranty reserve capacity is most recently below average. GM has been above average, with numerous data points between 24 and 36 months. And Tesla, at times, has kept its warranty reserve balance at two, three, or even four years, as befits a company with extra-long electric car battery warranties.
Accruals per Unit Sold
In Figure 4, we have taken the amount of accruals made per year and divided those amounts by the number of vehicles sold per year. This results in an annual measure of the average amount of money set aside as warranty accruals per vehicle sold.
Figure 4
American Auto Manufacturers
Accruals Made per Vehicle Sold
(in dollars, 2003-2019)
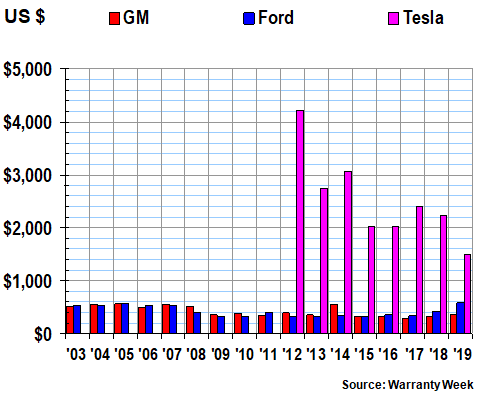
In 2019, GM accrued $356 per vehicle sold, based on sales of 7.7 million vehicles. Ford accrued $591 per vehicle sold, based on sales of 5.4 million units. Tesla accrued $1,510 per vehicle, based on 368,000 units sold.
In 2019, GM's automotive unit sales were down about 8.0%. For Ford, unit sales were down by 10%. For Tesla, unit sales soared by 50%. Together, the three companies sold 13.5 million vehicles, down around 7.8% from 2018 levels.
For GM, the accrual rate per vehicle was a slight increase over 2018 levels. For Ford, it was a massive 37% jump from $432 per vehicle in 2018, caused not only by rising accruals, but by also falling sales. For Tesla, the accrual rate per vehicle fell by almost a third, from $2,220 per unit in 2018. Tesla's accrual rate per vehicle is now falling into a range comparable to what the German luxury brands typically report. And the short-sellers are still complaining.
However, because Tesla is typically accruing in the thousands of dollars while GM and Ford are accruing in the hundreds, it's hard to plot them all in the same chart, and still make the GM and Ford trends visible. So Figure 5 sets aside the Tesla data, to focus on just GM and Ford.
Figure 5
GM & Ford
Accruals Made per Vehicle Sold
(in dollars, 2003-2019)
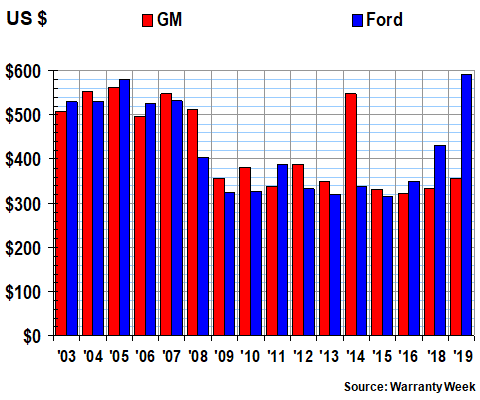
It's the same data as in Figure 4. But at this scale, it's much easier to see that not only has Ford's accrual rate been climbing for three consecutive years, but it's also now at its highest level of at least the past 17 years, surpassing the $579 per vehicle high water mark it left in 2005. And while GM is also rising recently, it's still far below the highs left in 2014, not to mention the 2003-2008 period.
Warranty Reserves
Finally, we have the balance left at the end of each year in the warranty reserve funds of the automakers. In Figure 6, it looks as if the 2019 balance is within more or less the same range as it's been since 2014: $14 billion to $15 billion.
Figure 6
American Auto Manufacturers
Reserves Held At Year's End
(in millions of dollars, 2003-2019)
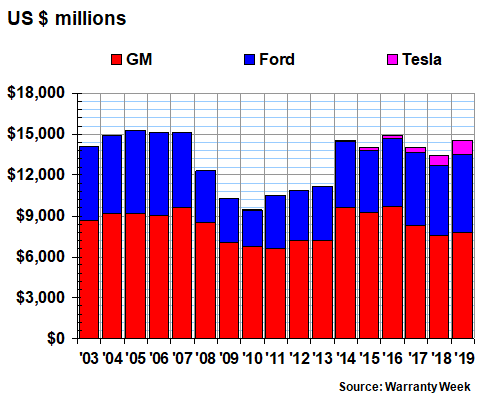
At the end of 2019, GM held $7.8 billion in reserves, up about $208 million from 2018 levels. Ford held $5.7 billion in reserves, up about $565 million from 2018 levels. And Tesla held about $1.09 billion in reserves, up from $748 million at the end of 2018. Total for the three of them was $14.59 billion.
Tesla is still an order of magnitude smaller than GM and Ford. In Figure 1, at the scale used, the Tesla claims data is visible for really only the past three years. However, in Figure 6, the Tesla reserve balance data is visible for five years. But we assure you, in both cases there is data going back to at least 2009. It's just too little to show up next to GM and Ford's billions.
Warranty Expense Rates
One other note: While Tesla's accrual rate per vehicle sold remains on the high side, the average selling price of those vehicles is also much higher, which lessens the pain of the impact. In other words, a $1,500 expense on a $60,000 product is not much worse than a $600 expense on a $25,000 product. Also, now that Tesla's accrual rate is under $2,000 per unit, it's close to what Mercedes or BMW report, while five to seven years ago Tesla was setting aside $3,000 to $4,000 per unit, which put it in a class of its own. In other words, Tesla's warranty costs are moderating, normalizing, or whatever word suggests methodical.
And if it wasn't said clearly enough in the Figure 2 discussion, for 10 out of the past 11 years, Tesla's electric car claims rate has been lower than those of its gasoline-driven competitors. Sure, the future costs of battery replacements remains a concern. But Tesla's claims rate is currently more than a full percentage point lower than GM's, and more than two percentage points lower than Ford's. That's a chart the short-sellers will not want to see.