Building Materials Warranty Report:
The warranty expenses of most companies in this industry are reasonably steady and predictable. Charts for both the total expenses and the average expense rates are fairly flat, compared to most industries.
As we begin to wind down our tour of warranty expenses in the building trades, it's time to look at the suppliers of fixtures, furniture, and other building materials. This week, we began our tour with a list of 119 U.S.-based companies that manufacture plumbing and electrical fixtures, office and household furniture, and other building materials.
From that list, we removed United Technologies, which was initially included because of its Otis Elevator operations, but was ultimately excluded because those operations comprise a very small part (between 1.5% and 4.0%, depending upon the metric) of a very large company's warranty expenses. In the future, however, we will include Otis in this category, now that it is a separate company (see last week's newsletter for more).The remaining 118 companies were split into three groups: 28 that manufacture plumbing and electrical fixtures, 34 that make furniture, and 56 that manufacture other building materials such as windows, flooring, roofing, carpets, and doors.
From the annual reports and quarterly financial statements of each company, we extracted figures for three warranty metrics: the amount of claims paid, the amount of accruals made, and the amount of warranty reserves held. We also gathered data on warranted product sales, and using that, we calculated both claims as a percent of sales (the claims rate) and accruals as a percent of sales (the accrual rate).
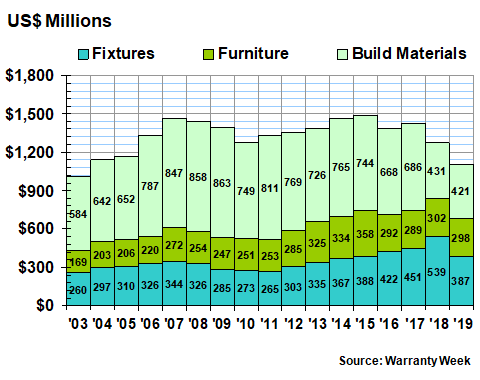
Warranty Claims Totals
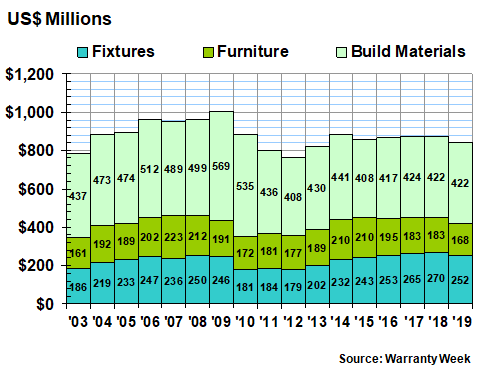
As can be seen in Figure 1, the amount of claims paid in 2019 fell by about $32 million to $842 million total. Claims reported by the fixtures manufacturers fell by $18 million; claims by the furniture manufacturers fell by $15 million; and claims by the other building material manufacturers were actually up slightly (though the rounded-off figures show no change).
It was the sixth consecutive year in which the overall total changed relatively little. However, for the furniture manufacturers, it was the lowest annual total since measurements began in 2003, and it was the fifth consecutive decline.
Figure 1
Building Material Warranties
Claims Paid by U.S.-based Companies
(in US$ millions, 2003-2019)
Stanley Black & Decker Inc., which is by far the largest warranty provider on the list of 118 companies, saw its claims total rise by $13 million or 11%. Others showing significant increases in claims payments included Crane Company, Hubbell Inc., Lincoln Electric Holdings Inc., Owens Corning, and PGT Innovations Inc.
Furniture manufacturers Tempur Sealy International Inc. led the declines, reporting a $14 million drop in its claims payments in 2019. Others reporting significant declines included Acuity Brands Inc., HNI Corp., Masco Corp., Nordson Corp., RPM International Inc., and Sherwin Williams Co.
Warranty Accrual Totals
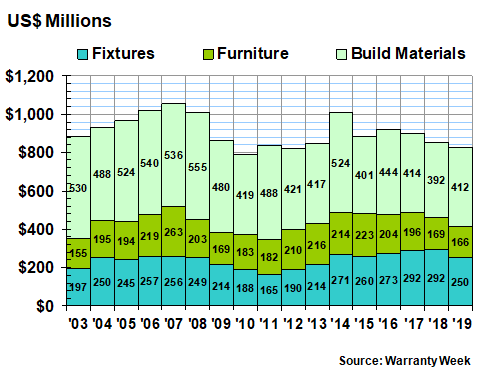
Warranty accruals also fell overall, though the makers of other building materials actually increased their accruals somewhat. The overall total fell by $26 million, but the makers of other building materials increased their accruals by nearly $20 million. And, as with claims totals, the accruals made by the furniture manufacturers was the lowest annual total since 2003.
Figure 2
Building Material Warranties
Accruals Made by U.S.-based Companies
(in US$ millions, 2003-2019)
Stanley Black & Decker, Lincoln Electric, Hubbell, and Herman Miller Inc. increased their accruals by significant amounts. Acuity Brands Inc., HNI, Masco, Nordson, Tempur Sealy, and Tennant Co. reduced their accruals by significant amounts.
Warranty Expense Rates
In Figures 3, 4, and 5, we're taking the data from Figures 1 & 2 and rearranging it to show how claims and accruals have changed when compared to sales data. In each case, the flatter the line, the more stable the data. Upward trends are bad and downward trends are good, as they reflect that warranty expenses are falling as compared to sales.
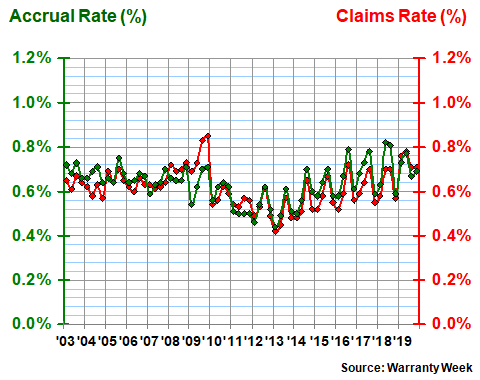
In Figure 3, we can see that the 28 manufacturers of plumbing and electrical fixtures have done a reasonable job at keeping their expense rates stable, even if they have been slowly rising since 2013. Over the long term, the claims and accrual rates for this group have averaged 0.6%, with the standard deviation staying relatively low at 0.1%.
Figure 3
Fixtures Manufacturers
Average Warranty Claims & Accrual Rates
(as a % of product sales, 2003-2020)
Masco reported one of the largest expense rate reductions in the group, cutting its claims rate from 0.8% to 0.5% and its accrual rate from 0.9% to 0.5%. Fortune Brands Home & Security Inc. saw slight reductions in both its expense rates, while Pentair plc saw slight increases in both.
Acuity Brands saw big jumps in its warranty expense rates, with both its claims and accrual rates rising from 0.6% to 0.9%. Crane saw its claims rate rise by a tenth of a percent while its accrual rate fell by a tenth of a percent. Hubbell saw both its claims and accrual rates rise significantly.
Furniture Expense Rates
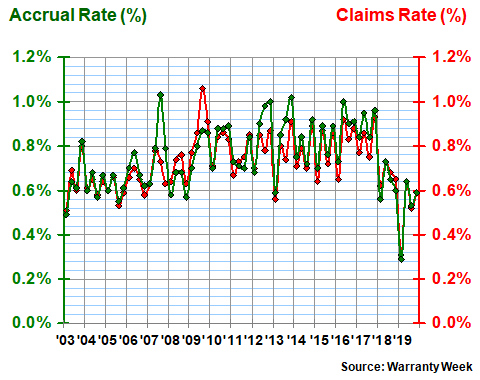
The warranty expense rates of the furniture makers has been a bit more variable, averaging 0.7% for claims and 0.8% for accruals, with a 0.15% standard deviation for both. As can be seen in Figure 4, the group also seems to show a somewhat seasonal pattern, with expense rates falling early in the year before rising again later in the year.
In early 2019, for instance, the group's claims and accrual rates both fell to 0.3%, before rising back to the vicinity of 0.6% for the next three quarters of the year. First-quarter low marks were also seen in 2013, 2015, 2016, and 2017, among others.
Figure 4
Furniture Manufacturers
Average Warranty Claims & Accrual Rates
(as a % of product sales, 2003-2020)
Tempur Sealy and Sleep Number Corp. saw the largest declines in claims rates, though Tempur Sealy raised its accrual rate while Sleep Number did not. HNI and American Woodmark Corp. saw modest declines in both their expense rates, while La-Z-Boy Inc. saw a modest decline in its claims rate and a modest rise in its accrual rate.
The only expense rate rise to note in this category was that of Herman Miller, whose claims rate was up just a bit while its accrual rate rose from 0.8% to 0.9%. Its product sales were also up slightly. In general, most of the largest warranty providers across all three sub-groups saw either slight increases or slight decreases in sales. Acuity Brands, with a 10% sales decline, was the exception.
Other Building Materials
Within the "other" group of 56 companies, four companies cut their claims rates significantly: RPM International, Sherwin Williams, Nordson, and Tennant. The latter two also cut their accrual rates significantly, while the former two raised their accrual rates slightly.
And then there were three companies that saw their claims rates rise moderately: Owens Corning, PGT Innovations Inc., and Lincoln Electric. The latter also doubled its accrual rate from 0.3% to 0.6%. The other two raised their accrual rates more modestly.
Figure 5
Other Building Material Manufacturers
Average Warranty Claims & Accrual Rates
(as a % of product sales, 2003-2020)
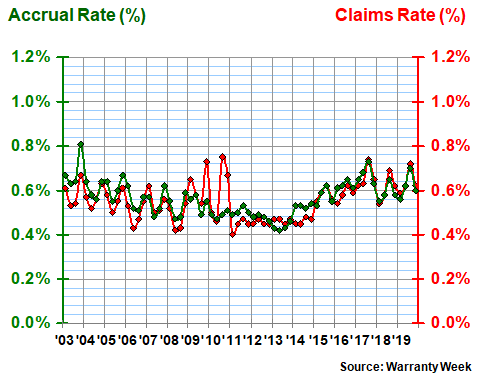
In Figure 5, we can see that this group has also kept its expense rates within a narrow band. The long-term average is just under 0.6%, while the standard deviation is just under 0.1%. Notice that the seasonal pattern seen in the last three years is absent from 2011 to 2016.
Warranty Reserve Totals
Our final warranty metric is the year-ending balance in the warranty reserve funds of the 118 manufacturers of building materials that we're tracking in this week's newsletter. For companies whose fiscal year ends on dates different than December 31, we measured the closing balance in the quarter that ended on or just before that date.
As of the end of last year, the building material manufacturers kept reserves of $1.1 billion, down by $167 million from the end of 2018. All three segments registered declines, though the drop was largest for the fixture manufacturers.
Figure 6
Building Material Warranties
Reserves Held by U.S.-based Companies
(in US$ millions, 2003-2019)
The reason the reserves of the fixture manufacturers fell so much was the decision made by Masco to sell off its windows and cabinetry product lines, leaving it with product lines such as faucets, bath and shower fixtures, outdoor lighting, and spa equipment. As a result of the reclassification of the windows and cabinetry lines of business as discontinued operations, Masco removed $136 million from its warranty reserve fund balance.
ACProducts Inc., which acquired the cabinet product line from Masco, has renamed itself the Cabinetworks Group. But the company is owned by the private equity firm American Industrial Partners, so we will have no further warranty expense data for its newly-expanded cabinet product line.
Other companies that reported large drops in their warranty reserve balances include Crane, Sherwin Williams, and Hubbell. Others that reported large increases include Sleep Number and Tempur Sealy International.