Solar & EV Warranty Report:
Because the new vehicles and power generation systems that rely on renewable energy sources are new, their warranty expenses are somewhat unpredictable. But the warranty metrics for some manufacturers are beginning to settle down, and the average expense rates are pleasantly low.
While it would be possible to track the warranty expenses of the renewable energy industry, many of the industry's leading products are part of much larger companies. General Electric and Siemens are market leaders in wind turbines. Toyota, Nissan, and General Motors are leaders in plug-in and hybrid electric vehicles. And if we included any one of them in some sort of industry index, their total warranty expenses would inundate the reports of the companies that make nothing but renewable energy products.
So instead, what we're going to do is slim down the vehicle roster to just two companies, and we'll skip over the wind turbine manufacturers completely for now. And we'll take a look at just four of the top U.S.-based solar power system manufacturers, or more precisely, three of the system manufacturers and one of the inverter manufacturers.
Let's begin with a pair of battery electric vehicle companies: the American car manufacturer Tesla Inc., and BYD Company Ltd., the Chinese maker of electric cars, trucks and buses. There are many other companies that manufacture battery electric vehicles and hybrid electric vehicles, in addition to traditional gasoline and diesel-powered models, but these two are what we'd call "pure plays" in the EV market. They make nothing but.
Tesla began reporting its warranty metrics in 2009, while BYD began only three years ago in 2017. We included both in our roundup of the world's automotive warranty expenses (Warranty Week, August 22, 2019), where we found both to have midrange claims rates, while Tesla had a higher-than-average accrual rate and BYD was again in the midrange.
Now we'll show their warranty expense rates in more detail. Tesla reports its claims and accrual totals on a quarterly basis. What we've done to produce Figure 1 is to divide both amounts by the corresponding sales totals, to calculate what percentage of revenue is going towards warranties.
As the chart shows, Tesla has seen its warranty expense rates vary from very high to very low levels over the past 11 years. Its accrual rate hit a high of 5.8% in 2010 and a low just under 2.3% in 2011, 2017, and again early this year. Its claims rate has ranged all the way from 4.5% in early 2012 to 0.4% for a brief moment in 2013.
This unpredictability has fed into the speculation surrounding the company's stock, with every rise and fall fueling or frustrating the short sellers that are betting on bad news. But long-term, Tesla's claims rate average of 1.6% is actually a bit lower than the industry average, though its 3.1% average accrual rate is a bit on the high side.
Figure 1
Tesla Inc.
Average Warranty Claims & Accrual Rates
(as a % of product sales, 2009-2020)
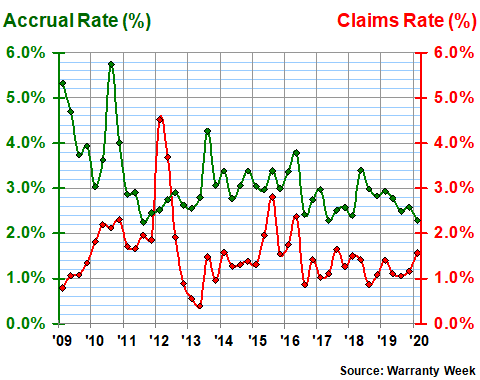
In the first quarter of 2020, Tesla reported paying $81 million in claims and making $119 million in accruals, for a claims rate of 1.6% and an accrual rate of 2.3%. A year before, Tesla paid $54 million in claims and made $113 million in accruals, for a claims rate of 1.4% and an accrual rate of 2.9%. Quarterly sales rose 26% in the interim.
Numerous other manufacturers make either all-electric or partially-electric hybrid vehicles, but only one other company makes nothing but EV and hybrid vehicles. And that would be BYD, whose name is an abbreviation of "Build Your Dreams." It's based in southern China, just outside of Hong Kong, and it reports its revenue and warranty expenses in yuan. But as we divide one amount by the other to find a company's warranty expense rates, the foreign currency drops out of the equation and we can chart these metrics on the same scale as was used for Tesla.
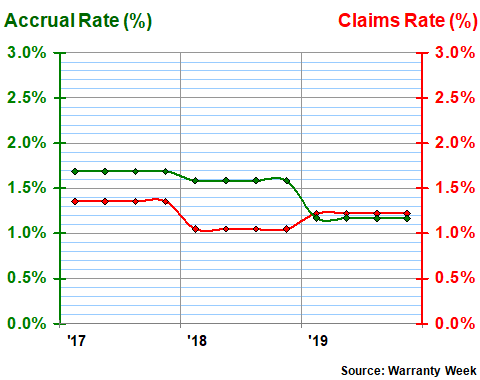
We should note that BYD has published only three years' worth of warranty data, and it publishes that data only once a year. Therefore, we really have only three pairs of expense rates for BYD, compared to 45 pairs for Tesla. In Figure 2, the percentage rates for each consecutive group of four quarters are identical, which reduces the seeming volatility of the data in and of itself.
However, both the company's claims and accrual rates, averaging 1.2% and 1.5%, respectively, are somewhat lower than Tesla's. And the company's claims and accrual rates are also much closer to each other than is the case with Tesla. In 2019 they were nearly the same, at 1.22% and 1.17%, respectively.
Figure 2
BYD Company Ltd.
Average Warranty Claims & Accrual Rates
(as a % of product sales, 2017-2019)
Besides passenger sedans, BYD also sells electric transit buses, coach buses, forklifts, on-highway trucks, garbage trucks, SUVs, and taxi cabs. So its product line is both more diverse and more commercial than Tesla's, although the Tesla Semi and the Cybertruck are on the way.
With other EV manufacturers such as Nissan, Kia, Hyundai, General Motors, Volkswagen, and BMW, the volume of gasoline-powered and diesel products is orders of magnitude larger. Therefore, external observers would not be able to tell whether the warranty expenses of the electric vehicles were higher or lower than the traditional product lines' claims and accrual patterns.
But what the Tesla and BYD data suggests is that the EV claims rates are lower, at least in this early stage of the market. And while Tesla's accrual rate is much higher than average, as both a percent of revenue and on a per-vehicle basis, this seems like more of a case of over-caution than actual cost. That's why there's such a wide gap between the lines in Figure 1.
Solar Energy Companies
Many of the top solar panel manufacturers are located in China or South Korea. But not many of them continue to report their warranty expenses to investors. Or, as with electric cars, their solar product expenses are rolled up with much larger non-solar product expenses, making a solar-only analysis impossible for external observers.
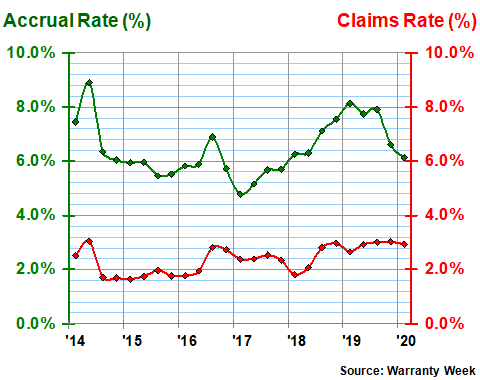
We've found four manufacturers, however, that make nothing but solar, and have also become reliable reporters of their warranty expenses. In Figure 3, we're looking at SolarEdge Technologies, a company whose headquarters is north of Tel Aviv, but which has installed systems in over 130 countries. Its stock is traded on the NASDAQ market, and its financials are reported to the U.S. Securities and Exchange Commission in U.S. dollars.
In Figure 3, we see a 25-quarter pattern where there are always multiple percentage points between the company's relatively high accrual rate (in green) and its relatively low claims rate (in red). Over the past 25 quarters, its accrual rate has averaged 6.4%, while its claims rate has averaged 2.4%. The closes they ever came to each other was in early 2017, when they were separated by 2.4%. But there was more than a 5% gap between them in both early 2014 and early 2019.
Figure 3
SolarEdge Technologies Inc.
Average Warranty Claims & Accrual Rates
(as a % of product sales, 2014-2020)
The net effect of this gap between claims and accruals is a needlessly large warranty reserve fund. At SolarEdge, the balance grew to $186 million by the end of March 2020. BYD's grew to 1.8 billion yuan (more than US$250 million) by the end of 2019. And Tesla's balance is now over $1.1 billion.
One cannot readily say what would be the "right" balance for each of these companies. However, we note that the ratio between claims and reserves, as measured in how many months would the current balance last, is 43 months for Tesla, 40 months for SolarEdge, and 30 months for BYD. Ford is at 15 months; Apple is at 11 months; and Cisco's ratio between claims and reserves is at only 6.6 months.
Of course, warranties in the solar power and electric car industries are typically much longer than is the case with the products they replace. Solar panels can be covered for as long as 25 years, though the inverter warranties are usually shorter. Electric car batteries are typically covered for eight years, though the rest of the vehicle's warranty terms may be shorter. So perhaps it makes sense for these companies to keep more reserves than is typical.
In Figure 4, we're looking at the past 61 quarters of warranty expense data filed by First Solar, a company with its headquarters near Phoenix, Arizona and with factories in Malaysia, Vietnam, and one located near Toledo, Ohio. Were it not for that sudden claims spike in 2012, the company's warranty expenses could be characterized as fairly predictable and not terribly high. But even with that spike, the company's claims rate averages out to 0.6%, with a 1.8% accrual rate.
Figure 4
First Solar Inc.
Average Warranty Claims & Accrual Rates
(as a % of product sales, 2005-2020)
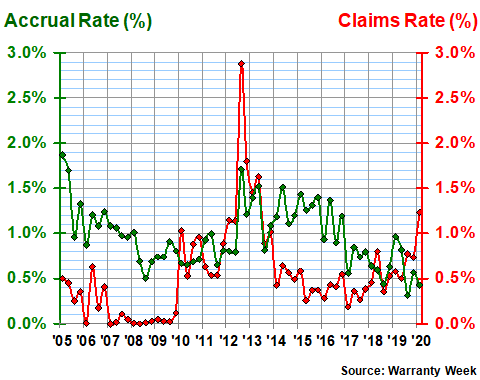
Readers should note that a new claims spike seems to be developing this year, although even the latest 1.2% claims rate seen in the first quarter of 2020 isn't all that high. In fact, claims were higher in the last quarter of 2019, though so were sales, which helps to keep the percentage rate down. Also, note that the company's accrual rate set a new low record of 0.3% midway through 2019, and was below 0.5% again in early 2020. That is not the pattern for a company whose claims are getting out of control.
SunPower, whose warranty expenses are detailed in Figure 5, does at times seem to be letting its warranty expenses get a little bit out of control. Last year was one of those times, when its claims rate peaked above four percent and its accrual rate briefly topped three percent.
Long term -- and we have 65 quarters of data for this manufacturer -- the average claims rate is 0.8% while the average accrual rate is 1.5%. However, the standard deviations for those averages are 1.0% and 0.75%, which reflects the massive range of the data.
Figure 5
SunPower Corp.
Average Warranty Claims & Accrual Rates
(as a % of product sales, 2004-2020)
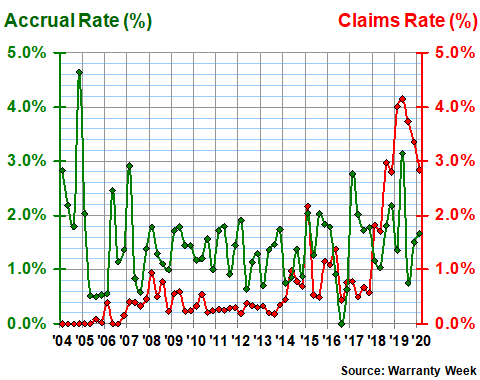
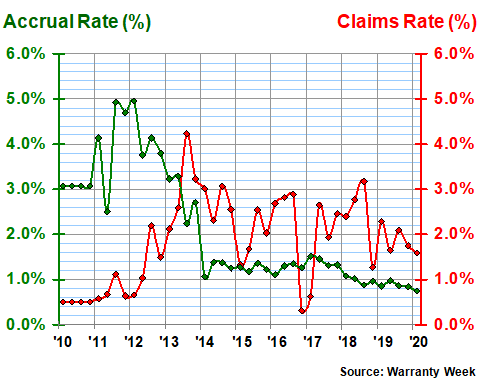
Finally, we have Enphase Energy, another company whose warranty data could never be described as predictable. In Figure 6 we see an accrual rate almost reaching five percent in 2011 and again in 2012, and plunging under 0.8% in early 2020. The long-term average is 2.1%, but the standard deviation is 1.3%. Claims average 1.9% of revenue, but that also comes with a relatively high standard deviation of 1.0%.
Figure 6
Enphase Energy Inc.
Average Warranty Claims & Accrual Rates
(as a % of product sales, 2010-2020)
What to make of this? First of all, even if we excluded the heavyweights such as GE and Siemens from an industry index, the totals and averages for the "pure play" renewable energy companies would not have much meaning, given how sloppy most of the data looks.
Second of all, some of these companies started out sloppy but have become relatively predictable. For instance, Enphase has kept its accrual rate steady to slowly declining for more than six years. BYD and SolarEdge have kept their rates steady as well. And Tesla and First Solar are setting new lows in recent quarters.
It's probably the same pattern at Nissan, GE, Siemens, and some of the other heavyweights. If they published their renewable energy warranty data separately, it might also be all over the page, especially when the products were first launched. But we'll never know, because every company publishes just one set of numbers for all their products in all their markets.