First Quarter Homebuilder Warranty Report:
Those who expected a free-fall because of the lockdowns are likely to be pleasantly surprised how non-dire the data looks so far in early 2020. Then again, reports from the second quarter, which ends next week, are expected to show more extensive damage, in spite of all the partial reopenings.
So much has changed since we last took a look at the warranty expense reports of the builders of new homes in March. First of all, it's official: the National Bureau of Economic Research said the U.S. economy peaked in February 2020, and is now in a recession. How deep we know not yet. Second of all, the proximate cause of that recession is the virus that ravaged China and Europe early in the year and is now having its way with the U.S., Brazil, and Russia, among others.
To put it mildly, these are not the ideal conditions in which to buy a new home. Spending time indoors with strangers can turn out to be a deadly risk. Yet U.S.-based homebuilders have recently reported some not-too-dismal conditions for the first quarter of 2020, or at least for the period before the shutdowns began. Sales were up and warranty expenses were steady, though prices were down and the recent peak of the market is definitely now behind us.
Financial Statements
We reported the annual data for the past 17 years in that March newsletter. This week, we aim to report the data for the past 69 quarters, looking for the same sort of early warning of a recession that we saw from this industry's data in 2007. As usual, we began with a list of 55 current and former new home builders that report their warranty expenses to the U.S. Securities and Exchange Commission in their annual reports and quarterly financial statements. From each company's reports, we gathered figures for claims paid, accruals made, and reserves held.
We also gathered two additional metrics: the number of homes sold per quarter by each company, and the revenue generated by those home sales. Using that data, we were able to calculate the accruals made per home sold, as well as the percentage of revenue going towards accruals. Therefore, we actually have two ways to measure the accrual rate.
But first, in the next three charts below we are detailing the quarterly totals for claims, accruals, and reserves. In Figure 1, we are looking at 69 quarterly totals for claims paid, with the first quarter of 2020 coming in at $187 million, up about $900,000 from year-ago figures.
Figure 1
Homebuilding Warranties
Claims Paid by U.S.-based Builders
(in US$ millions, 2003-2020)
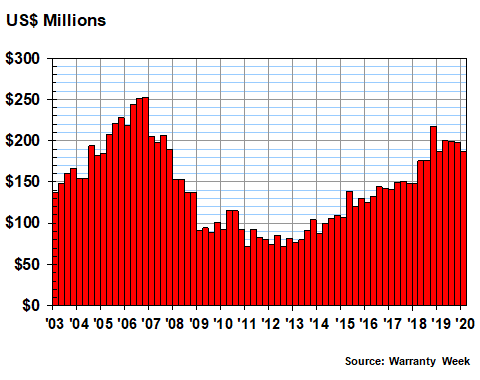
Note that the claims totals for the second, third, and fourth quarters of 2019 were higher than this most recent total. Also note that the $218 million total for the fourth quarter of 2018 was higher than all of them. The more data we collect, and the more time that elapses, the clearer the picture becomes: the industry may have peaked at the end of 2018.
In Figure 2, we're looking at the quarterly total for warranty accruals made. Here, there seems to be a seasonal pattern in which the first-quarter figures are the lowest of the year, while the fourth-quarter figures are the highest. And for nine years in a row, the first-quarter accrual totals have been up from the total in the same quarter a year before. This year, the total is $155 million, up from $139 million in the first quarter of 2019.
Figure 2
Homebuilding Warranties
Accruals Made by U.S.-based Builders
(in US$ millions, 2003-2020)
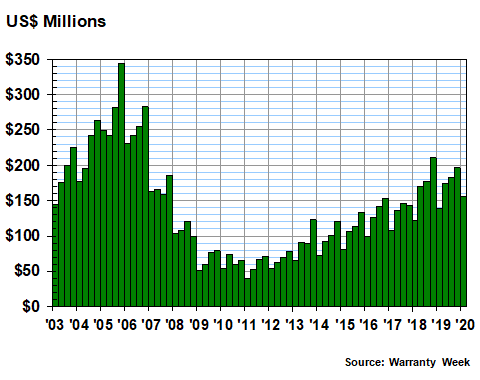
The builders we're tracking reported sales of 53,264 homes in the first quarter, up by 12.4% over the same period in 2019. Revenue was up by 5.7%. And accruals were up by 11.6%. None of these comparisons suggest either a peak or a subsequent decline. Yet here again, the industry's accruals topped out at the end of 2018.
Our third warranty metric is the balances held in the warranty reserve funds of all the builders at the end of each quarter. As of March 31, 2020, that balance was $1.34 billion, down by about $14 million from the balance on March, 31, 2019, and down about $58 million from the end of calendar 2019.
Figure 3
Homebuilding Warranties
Reserves Held by U.S.-based Builders
(in US$ millions, 2003-2020)
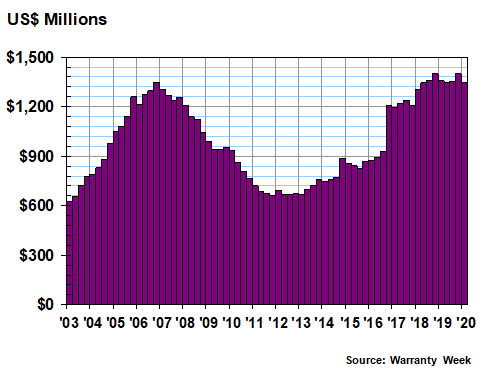
Note again that the end-of-year 2018 balance was the highest in recent years. It's a little hard to see, but the balance at the end of the fourth quarter of 2018 was about $600,000 higher than it was at the end of the fourth quarter of 2019. So yes, all three of the major warranty metrics of the new home building industry peaked six quarters ago.
Two Different Accrual Rates
In every major industry segment, we measure the accrual rate by taking the total amount of accruals made and dividing it by sales revenue, to calculate the percentage of revenue going towards warranty accruals. We do it that way for homebuilders as well, after making sure to deduct all non-warranted revenue sources such as land sales, mortgage, or finance income.
Fortunately, the builders also give us another option. Each builder consistently releases figures for the number of new homes sold, or homes closed, as is the preferred industry terminology. Because warranty accruals are supposed to be made at the time a product is sold, we can calculate the amount of accruals made per home sold, by dividing one total by the other.
In Figure 4, this is exactly what we are doing. The green line tracks the accrual rate as a percentage of revenue, using the right-hand scale. The blue line tracks the average accruals made per home sold, and it uses the left-hand scale.
Figure 4
Homebuilding Warranties
Average Warranty Accrual Rates
($ per home and % of revenue, 2003-2020)
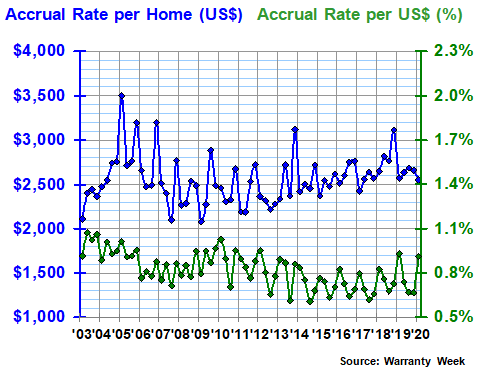
Over the past 69 quarters, the average accrual made per home sold has been $2,556, with a standard deviation of $267. The average accrual rate as a percentage of revenue has been 0.8%, with a standard deviation of 0.1%. Both lines seem to follow a seasonal pattern, though the rate per home tends to peak in the final quarter while the accrual rate as a percentage seems to peak in the first quarter of each year.
In the first quarter of 2020, the accrual rates were $2,552 and 0.9%, a little lower and higher, respectively, than the long-term averages. However, a quick glance at the chart suggests there hasn't been much movement of either average from one year to the next. The fluctuations seem to be more seasonal than annual. In other words, the averages have remained fairly stable over the past 18 years.
Accruals Made Per Home Sold
In the next five charts, we want to detail the accruals made per home for 20 different builders. In each case, we suggest you compare each company's chart pattern to the industry average you see in blue in the chart above.
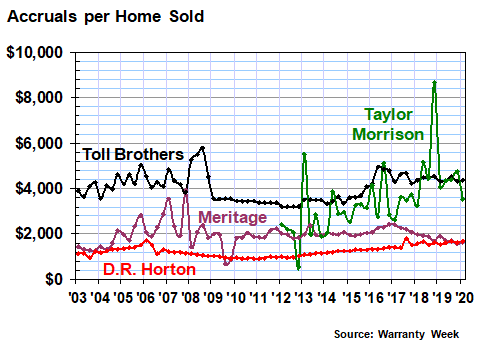
In Figure 5, we're looking at the history of Toll Brothers Inc., D.R. Horton Inc., Meritage Homes Corp., and Taylor Morrison Home Corp. Toll Brothers in particular is known for sales of luxury homes, so it's entirely appropriate to see them accruing $4,000 or even $5,000 per home sold. D.R, Horton is known for sales of basic starter homes, so again it's no surprise to see them accruing closer to $1,250 per home sold.
Instead, what's a bit surprising is how steady the data is for both D.R. Horton and Meritage. Stability can be measured by the standard deviation, which is the lowest of all for D.R. Horton at $236. Meritage is close behind at $481.
Figure 5
Homebuilding Warranties
Warranty Accruals Made per Unit Sold
(in US Dollars, 2003-2020)
In Figure 6, we're looking at the tangled records for M.D.C. Holdings Inc., KB Home, PulteGroup Inc., and Century Communities Inc. Pulte has the most stable data among them, which isn't saying much. Its average accruals per home is $2,791, with a rather large standard deviation of $642.
Figure 6
Homebuilding Warranties
Warranty Accruals Made per Unit Sold
(in US Dollars, 2003-2020)
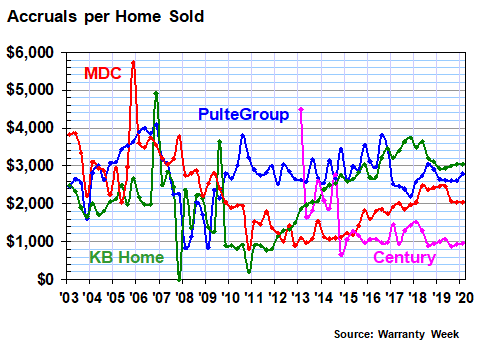
Note that in one quarter at the end of 2007, KB Home made no accruals at all. It sold more than 8,100 homes that quarter. But because every home was perfect, it did not need to make any accruals at the time of sale. In the next few charts, we will see that it's not the only builder to achieve this remarkable level of product quality.
In Figure 7, we're tracking the accruals made per home by Beazer Homes USA Inc., Hovnanian Enterprises Inc., NVR Inc., and New Home Company Inc. Though their long-term averages are both above and below the industry average, they're together on this chart because they share an extremely high level of volatility.
Figure 7
Homebuilding Warranties
Warranty Accruals Made per Unit Sold
(in US Dollars, 2003-2020)
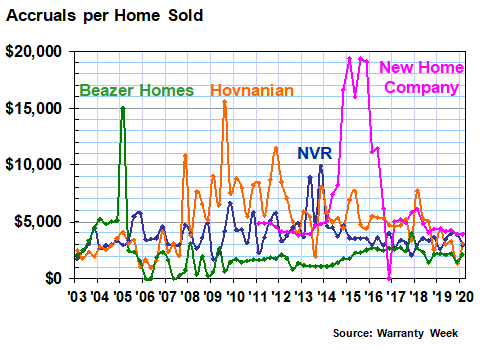
New Home Company, in fact, tops the list for both metrics. Its average accrual made per home is $6,854, while the standard deviation of that data is $4,928. In 2015, the company also set the record for most accruals made per home, when in three of that year's four quarters it set aside more than $19,000 in accruals per closing. In contrast, Hovnanian peaked at $15,536 per home in 2009, while Beazer peaked at $14,986 per home in early 2005. NVR just missed surpassing $10,000 per home in 2013.
Also note how often the accrual rate per home drops to zero, or close to it. We were only kidding -- it's not because every home was perfect. Instead, what it illustrates is how easy it is to raise or lower the accrual rate when nobody is paying attention, and all eyes are instead on the bottom-line figures for net income.
Incomplete Data
In Figure 8, we're looking at the track records of four more builders: William Lyon Homes, M/I Homes Inc., Shea Homes LP, and LGI Homes Inc. William Lyon Homes was acquired last year by Taylor Morrison Home, so there is no data for either the fourth quarter of 2019 or the first quarter of 2020. LGI Homes went public at the end of 2013, and in its initial financial statements it helpfully included warranty expense data for 2012. Shea Homes was never a public company, but it sold some bonds which required it to report its warranty expenses to the SEC from 2010 to 2014.
Figure 8
Homebuilding Warranties
Warranty Accruals Made per Unit Sold
(in US Dollars, 2003-2020)
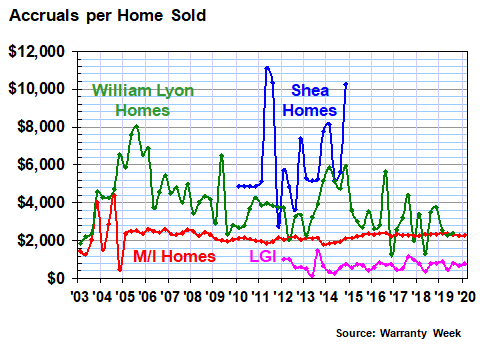
At $697, LGI has the lowest accrual rate per home in the industry. And it has the second-lowest standard deviation as well, right behind D.R. Horton. Meanwhile, William Lyon and Shea Homes are above the median for both measures. But M/I Homes, if not for a rough 2003 and 2004, would hold the title for the most consistent long-term warranty accrual rate in the industry. Its average accrual per home sold seldom deviates by much from its #2,238 long-term average.
Our last group of builders is really just one builder: Lennar Corp. As for the other companies named on this chart, Standard Pacific Corp. and Ryland Group Inc. merged in 2015, and the surviving company renamed itself the CalAtlantic Group Inc. And then in 2018, Lennar acquired CalAtlantic.
Figure 9
Homebuilding Warranties
Warranty Accruals Made per Unit Sold
(in US Dollars, 2003-2020)
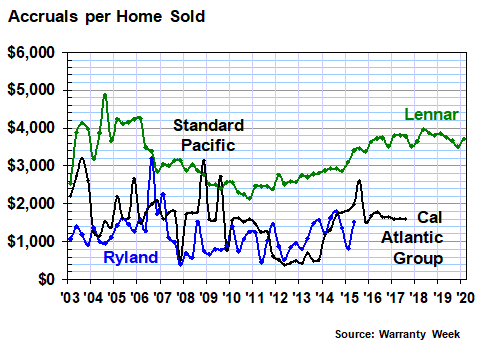
Note that over the past decade, Lennar has gradually increased the amount of accruals made per home sold. At the end of 2010 its average was $2,145 per home sold. By early 2020, it was up to $3,708 per home sold. Also note that in recent years, accrual rates have followed a seasonal pattern, topping out in the spring and summer of each year.
So those are the track records of the 20 largest builders for which we have reliable sales and warranty data over the long term. Many builders were washed out of the market during the last recession, so we're not including them here. And while it's now clear that 2018 was yet another market peak, and while a new recession is said to have begun in February 2019, we have yet to see any real damage done to the totals or averages so far.
Conventional wisdom had it that the pandemic would cause a sharp drop in sales in March and April, followed by a gradual recovery in May and June, with the third and fourth quarters of 2020 approaching normal. However, as we reach the end of June 2020, what was supposed to be the end of the pandemic and the beginning of a reopening has been thrown into doubt by the spiking infection data in some of the southern states.
We don't track the new home data by state or region, but we would suggest that the hottest markets for new homes are located in some of the very same places now getting slammed the hardest by the virus. And it's difficult to imagine how either construction or house-shopping will look in the second half of this year. As the investors say on Wall Street, we have no visibility of the future, and we're discontinuing our guidance.
Happy Holidays - Summer Edition
The long Fourth of July weekend begins next week, so we would normally be skipping a newsletter for that holiday. But a quick look at the calendar reveals that we haven't actually taken a break all year, even during the month of April, when the pandemic peaked here in New York. So this year we are going to make July a month of holidays, and skip the next bunch of newsletters.
On August 6th we will return relaxed, tanned, and hopefully still healthy, by which time we hope to have all the pandemic-delayed European and Asian warranty data in hand, so we can finally complete our estimates of the worldwide annual warranty spends of the passenger car, truck, airplane, and construction equipment industries. By then we'll also know how bad things were for manufacturers and retailers in the dismal quarter now ending.
And while there won't be any warranty industry meetings or conventions any time soon, we just received word that the annual Extended Warranty and Service Contract Innovations show normally scheduled for October in Nashville is going to happen online instead. Details to follow soon.