Asian Auto Warranty Expenses:
While the Japanese and Indian car manufacturers had plenty of time to react to the global pandemic in their most recent fiscal years (which ended in March), the Korean and Chinese companies also seem to have seen it coming. Warranty accruals are down along with sales, and so are reserves, while claims are up. But the Chinese warranty metrics remain baffling.
Most of Asia's passenger car and light truck manufacturers are based in Japan, Korea, India, and China. But while most share many traits and have warranty metrics similar to those based in the U.S. and Europe, the companies based in China are publishing baffling warranty statistics in their annual reports.
We selected 12 passenger car and light truck manufacturers based in Asia, with the top criteria for selection being a steady history of reporting their warranty expenses in their annual reports. Three of our selections are based in Japan: Toyota Motor Corp.; Honda Motor Co. Ltd.; and Nissan Motor Co. Ltd. Two are based in South Korea: Hyundai Motor Co.; and Kia Motors Corp. And one is based in India: Tata Motors Ltd., which acquired Jaguar Land Rover Ltd. from Ford in 2008.
In addition, of the dozen or so car manufacturers we have identified that are based in China, six of them are more or less steady reporters of their warranty expenses: BAIC Motor Corp. Ltd., a subsidiary of the Beijing Automotive Industry Holding Co., Ltd.; BYD Auto Company Ltd., a subsidiary of Build Your Dreams Company Ltd.; Changan Automobile Co. Ltd.; Dongfeng Motor Group Company Ltd.; GAC Motor Co. Ltd., a subsidiary of Guangzhou Automobile Group Co. Ltd.; and SAIC Motor Corp. Ltd., formerly known as the Shanghai Automotive Industry Corp.
For each company and from each annual report, we collect three warranty metrics per year: the amount of claims paid, accruals made, and reserves held. We also collect data on the amount of automotive product revenue, and the number of vehicles sold. With these, we calculate three additional metrics: warranty claims as a percentage of sales (the claims rate), warranty accruals as a percentage of sales (the accrual rate), and warranty accruals per new vehicle sold.
Different Fiscal Years
The Japanese and Indian companies follow a fiscal year that begins on April 1 and ends on March 31. In these cases, we shift their warranty metrics back by three months, so they line up with the calendar year. However, this also means we have to wait until they publish their annual reports -- Tata didn't do so until three weeks ago, though Toyota and Honda did so in June.
Also, each company reports its warranty expenses in its native currency, so in order to add them into the worldwide automotive report we are publishing next week, we had to translate all the figures into U.S. dollars. That has its own challenges, caused primarily by the wild fluctuations in the dollar's exchange rate over the past decade.
For instance, there were 45 Indian rupees to the dollar in 2010 and 2011. Now there are 75 rupees to the dollar. Also, Tata reports its financial figures in lakhs and crore, which have to be converted into thousands, millions, and billions.
Some Chinese companies publish their financial figures in units of 100 million yuan, but most follow the international convention of millions or billions. The more significant problem is the relative lack of change in the yuan-to-dollar conversion rate over the past decade, compared to the wild ride of some other currency pairs. While the Indian rupee, Japanese yen, and Korean won have gyrated wildly against the dollar, the Chinese yuan has varied between only 6.4 and 7.0 to the dollar.
Some would say it's being kept artificially low by the Chinese government in order to benefit exports. However, among Chinese car manufacturers there is not yet much exporting, so this is not yet a concern for them. But it does mean that in reports such as this, exchange rates between the yuan and the yen, rupee, and won have gyrated wildly as well. And this can artificially enlarge or diminish the size of each company's annual totals, when compared to each other.
A more important concern is whether each Chinese manufacturer is reporting all of its warranty expenses. Most are engaged in one or several joint ventures with other Asian, European, or American manufacturers, and most also have their own brands. Depending on how those joint ventures are structured, the Chinese partners may be reporting all of their revenue and vehicle sales but only a portion of their warranty expenses. In other words, the numbers are right, but our claims and accrual rate calculations may be artificially low.
We should also note that all these figures are reported by each company on a worldwide basis, with one set of numbers for all its subsidiaries. So Toyota is reporting sales figures and warranty expenses for all the cars they sell worldwide, and not just those it makes or sells in Japan. Likewise, Toyota is reporting for not only its Toyota-brand vehicles, but also for brands such as Lexus, Daihatsu, and until 2016, for Scion as well.
Asian Warranty Claims Paid
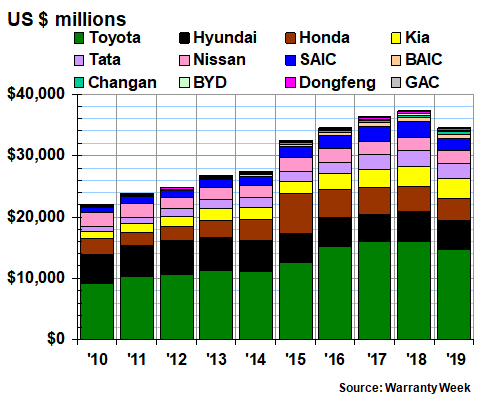
In Figure 1 we are looking at the reports of warranty claims paid by 12 of the top Asian manufacturers over the past decade. Toyota is by far the largest, reporting the equivalent of $4.67 billion in claims paid in the most recent fiscal year. Honda was second, with $2.39 billion, and Hyundai was third, with $1.94 billion in claims paid last year.
Figure 1
Asian Auto Manufacturers
Claims Paid per Year
(in millions of dollars, 2010-2019)
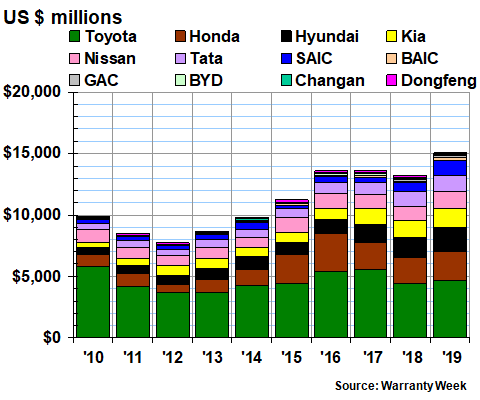
The total amount of claims paid by all 12 of these companies rose by $1.85 billion to $15.08 billion last year. It was a new high for the group, and their first time over $15 billion. We believe that once all the other non-reporters in China, Japan, India, Iran, Turkey, and elsewhere in Asia are added in, the Asian claims total would rise above $19 billion.
In terms of changes since 2018, among the I-J-K countries, Hyundai saw the largest jump in claims paid, at +$335 million, while Honda was second at +$284 million and Nissan and Toyota tied for third at +$218 million apiece. Kia was fifth at +$169 million and Tata was sixth at +$46 million.
None saw a decrease in claims paid, either in dollars or in their native currencies. However, we should note that Toyota's claims total, at least when denominated in yen, barely changed from fiscal 2018 to fiscal 2019. So it was the shift in the yen-dollar conversion rate that produced most of the +$218 million change.
Others actually fared much better due to shifts in foreign exchange rates. For instance, Tata's claims bill went up by 14% when denominated in rupees, but by only 4% in dollars. Kia's claims went up by 19% in won but by only 12% in dollars. Of course, it's the calculations in the native currencies that affect net income. The dollar fluctuations are already built into those figures, in the sense that if Tata or Kia paid an American dealer for warranty work, it already translated those amounts for its annual report.
Among the Chinese companies, Dongfeng has reported its warranty expenses in each of the past 10 years. BAIC has been reporting for the past seven years. BYD has reported for the past five years. The GAC Group has reported for the past four years.
Dongfeng and BYD actually reported annual decreases in their claims payments -- the equivalent of -$72 million and -$8.9 million, respectively. In contrast, BAIC saw a +$75 million jump in claims, and GAC reported a +$12 million rise.
Neither SAIC nor Changan has reported its warranty expenses yet for 2019. But SAIC reported its warranty expenses from 2016 to 2018, while Changan reported for the nine years up to 2019. In hopes that they may one day fill in the gaps with actual numbers, we have included them here, using our own estimates in place of the missing data.
There are several other automakers based in China that have never reported their warranty expenses publicly. They include Chery, FAW, Geely, Great Wall, and JAC Motors, among others. Some are quite large -- in fact, the government-owned FAW Group is ranked as the third-largest automaker in China. So this adds another measure of uncertainty to the Chinese warranty expense totals.
Asian Warranty Claims Rates
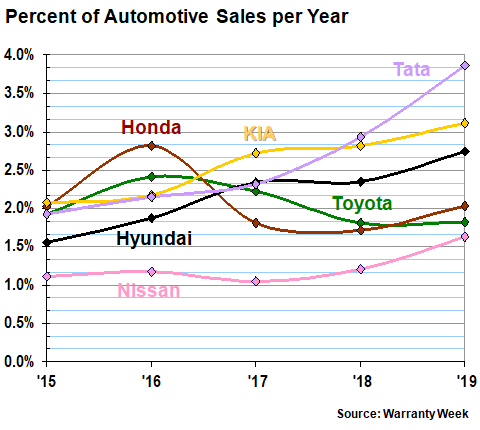
In Figure 2, we are looking at the past five years of claims paid divided by sales made, which equals the claims rate, in percentages of sales. All six of these manufacturers saw increases. Tata saw the biggest jump, from 2.9% to 3.9%. But on a proportional basis, Nissan's was slightly larger. Toyota saw the smallest increase -- a barely perceptible 0.02% rise.
Figure 2
Asian Auto Manufacturers
Warranty Claims Rates
(as a percentage of sales, 2015-2019)
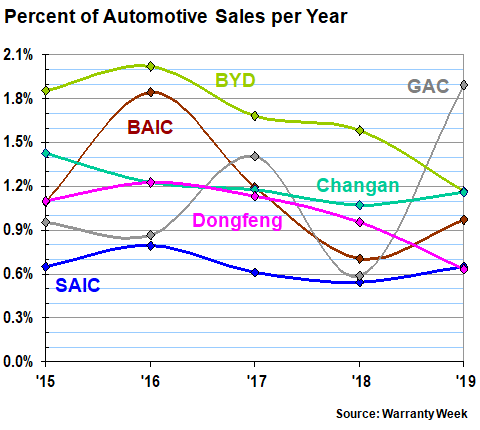
In Figure 3, we're tracking the claims rates of the six Chinese manufacturers over the past five years. Among them, Dongfeng was the only one to see a decrease, with its claims rate falling from 1.1% to 0.6%. BAIC, BYD, and GAC saw rises of between 0.2% and 0.4%. And our own estimates of Changan and SAIC show Changan a bit below that range of increases while SAIC's increase was a bit above it.
Figure 3
Asian Auto Manufacturers
Warranty Claims Rates
(as a percentage of sales, 2015-2019)
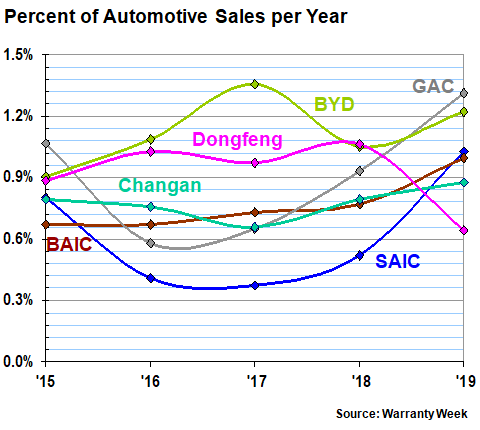
Note the big difference between the range of the data in these two charts. In Figure 2, the only Indian, Japanese or Korean manufacturer to spend any time below 1.5% is Nissan. And in Figure 3, BYD (which has very successfully been exporting its electric vehicles abroad) comes closest to that 1.5% line, without ever crossing it. In other words, the lines have never crossed.
Are we to infer that Chinese vehicles are somehow the best in the world? Or should we suspect that somehow the data isn't right? The problem is, those are the right numbers, and that's the right math. Out of the 30 data points in the Figure 3 chart, 26 are based on numbers taken straight out of the annual reports of the manufacturers themselves. And the four data points that are based on estimates are each on the high side (Changan & SAIC in 2019, GAC & SAIC in 2015).
In other words, if it's not the math, it must be the methodology. We are just as baffled by this phenomenon as we were by the fact that Boeing could pay three times as much claims as Airbus last year when their sales totals were comparable (see the August 6 newsletter for details). Something must be different in the way warranty expenses are counted, apportioned, allocated, or reported, because the math just doesn't look right, even if it is.
Asian Warranty Accrual Totals
In Figure 4 we're looking at the amount of warranty accruals set aside by each of the 12 manufacturers during each of the past 10 years. Unlike the pattern set with claims (Figure 1), the net amount of accruals has been steadily declining since peaking in 2015. Some of that is due to the diminishing costs of dealing with the Takata air bag recalls. And some of it, sadly, has to do with falling sales, at least in the most recent reports.
Figure 4
Asian Auto Manufacturers
Accruals Made per Year
(in millions of dollars, 2010-2019)

On a dollar basis, Toyota literally slashed its accruals from $5.14 billion in fiscal 2018 to just under $3.0 billion in fiscal 2019. But don't blame it on the dollar. In its native currency, the annual accrual total fell from 565 to 314 billion yen. That was its lowest accrual total since 2006.
Hyundai, meanwhile, increased its accruals from $1.54 billion to $2.13 billion. In its native won, the increase would look even worse. Kia, however, kept its accruals about the same, at least in dollars. Nissan increased its accruals by +$55 million. Tata cut its accruals by -$91 million. And Honda cut its accruals by -$226 million.
At this scale, the Chinese accrual totals are almost imperceptible in this chart. So let us spell them out for you. Among the four manufacturers that reported, BAIC went from $162 million in 2018 to $246 million in 2019; GAC rose from $64 million to $164 million; BYD declined from $172 million to $101 million; and Dongfeng fell from $145 million to $87 million. And we estimate that accruals rose for SAIC and Changan by about 10% apiece last year.
With all those figures factored in, we estimate that accruals for the 12 companies named in Figure 4 fell by about -$1.68 billion to just under $12.68 billion. Sharp readers will already have noticed that this is about $2.4 billion less than the claims total described in Figure 1. Furthermore, it's the first time in the past decade that claims have outpaced accruals. This is a very bearish signal -- that the warranty expenses for future sales will be far below current levels, not because of rising quality but because of falling sales.
If we were to add in all the estimates we are maintaining for the non-reporting manufacturers in Asia, we estimate that the continent's total would rise to about $15.8 billion in 2019. However, that's still more than three billion dollars below the claims total, and is an even larger gap than is seen with this cohort. In other words, they saw the slowdown coming, whether their fiscal years ended in December (China & Korea) or in March (Japan & India).
Asian Warranty Accrual Rates
Once again, we're splitting our dozen into six companies from India, Japan, and Korea, and six companies from China. In Figure 5, we're looking at the six IJK companies. (Heard of the BRICs -- Brazil, Russia, India, China? Or even better, the CIVETS -- Colombia, Indonesia, Vietnam, Egypt, Turkey and South Africa? Well, we're coining a term here: the IJKs).
Among the IJKs, three cut their accrual rates while three raised them. And four of those were quite large, in relative terms. Toyota cut its accrual rate from 2.1% to 1.2%. Hyundai raised its accrual rate from 2.3% to 3.0%. Tata raised its accrual rate from 3.5% to 4.2%. Nissan raised its accrual rate from 1.2% to 1.4%.
Figure 5
Asian Auto Manufacturers
Warranty Accrual Rates
(as a percentage of sales, 2015-2019)
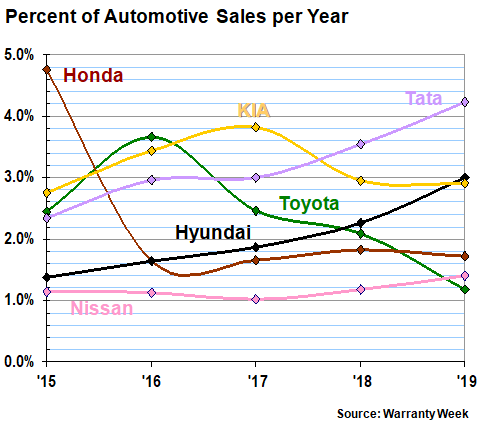
Given that the amount of accruals a company makes is a choice, we are comfortable using active verbs to describe their decisions. Normally, they accrue a set amount every time a vehicle is sold. When they change that amount, they usually do it for a solid reason, related to product quality, repair cost, future recalls, etc. However, no reasons were announced.
The only Asian auto manufacturer that kept its accrual rate about the same from 2018 to 2019 was Kia. And though at this scale the chart makes it look like the rate remained unchanged at just under 3.0%, it actually declined ever so slightly, from 2.96% to 2.91%. but that's the way it should be done: absent any change in product quality or average repair cost, the accrual rate should remain about the same.
Chinese Accrual Rates
In Figure 6, some of the changes are even more extreme. For instance, GAC more than tripled its accrual rate from 0.6% to 1.9%. This is not an estimate. Dongfeng cut its accrual rate from a meager 1.0% to an unbelievable 0.6%. BAIC raised its accrual rate from 0.7% to 1.0%. And BYD cut its accrual rate from 1.6% to 1.2%.
Figure 6
Asian Auto Manufacturers
Warranty Accrual Rates
(as a percentage of sales, 2015-2019)
Proportionally, the two estimates on the chart -- for SAIC and Changan -- represent the two smallest annual changes among the group. Because the two did not report their 2019 accruals in their annual reports, we assigned each an 0.1% increase.
With this metric, however, there would be some line-crossing between China and the IJK companies. BYD, for instance, has seen its accrual rate rise above 2.0%. GAC was most recently at 1.9%. BAIC has risen as high as 1.8%. And in their most recent fiscal years, Toyota, Honda, and Nissan were well below those levels.
Accruals per Vehicle Sold
There is another way to measure the accrual rate, and this one more closely aligns with the way accrual rates are supposed to be determined. Every time a company sells a product, it is supposed to predict the average future cost of the warranty work it will need, and set that amount aside. And so, since we know how much the companies are accruing, as well as how many vehicles they sell, it's a straightforward process to figure out how much they are accruing per vehicle sold, on average.
In Figure 7, we're listing the 12 accrual rates per vehicle sold in descending order for 2018, and again for 2019. Tata is by far the outlier, accruing $1,187 in 2018 and $1,478 in 2019. But then again, it now owns Jaguar Land Rover, which is essentially a British luxury car manufacturer. And so, it accrues about as much as Daimler or BMW, which are German luxury car makers. In fact, in 2006, which is the last full year before Tata made the JLR acquisition and became a luxury vehicle maker, it accrued only $133 per vehicle.
Figure 7
Asian Auto Manufacturers
Accruals Made per Vehicle Sold
(in dollars, 2018-2019)

At the other extreme, we don't know what to make of Dongfeng's accrual rate falling from $37 to $30 per vehicle sold. That's what you'd accrue for an iPhone or a nice refrigerator, not a new car. To our credit, in the two spots where we had to insert our own conjecture, we estimated that SAIC's accrual rate rose from $80 in 2018 to $124 per unit sold in 2019 while Changan's estimated accruals per car rose from $50 to $67. But along with GAC's rise from $72 to $78, all these low numbers are hard to believe.
But then again, BYD is at $218 per unit while Nissan is at $238. Neither is government-owned and both are well-known worldwide exporters. And Toyota is not far above that, back down from its former heights to $334 per vehicle in fiscal 2019 (from as high as $920 in fiscal 2016). Even Honda, at $609, is accruing half as much as it did at the height of the Takata air bag mess. So while at one end of the chart we question the methodology, at the other end the math looks about right.
Asian Warranty Reserves
We have one more metric to detail for you. In Figure 8, we are listing the closing balances in the warranty reserve funds that have been reported by the 12 Asian automakers we're tracking in this newsletter. And we do stress the word reported -- unlike the data in Figures 1 or 4, we had to create estimates for only 17 of the 120 data points in Figure 8, and only one in 2019 (for Changan). Even SAIC reported its warranty reserve balance last year (though that was the only warranty metric it reported).
Of the 11 automakers that reported their year-ending 2019 balances, nine reported lower balances than they did at the end of 2018. Tata and GAC were the only exceptions. And at +$12 million, Tata's increase was almost imperceptible, while at +$46 million, GAC's was actually quite substantial (as well as almost imperceptible at this scale).
Figure 8
Asian Auto Manufacturers
Reserves Held At Year's End
(in millions of dollars, 2010-2019)
Overall, it was the first annual decline of the decade, with the warranty reserves of these 12 companies falling from $37.24 billion in 2018 to $34.52 billion in 2019. Again, given that many of the big players didn't end their fiscal years until two months after authorities declared a worldwide public health emergency, it's no surprise to say that they acted appropriately in the face of a coming slowdown.
One more note on the effect of using U.S. dollars as the compromise: while in dollar amounts, Tata's increase in reserves from $2.54 billion to $2.55 was imperceptible, in its native currency Tata's balance rose more than 10%. A better way of putting that is to say that just to keep pace with changing exchange rates, Tata had to boost its reserves, denominated in rupees, by more than 10% last year. Now that the dollar is falling, the 2020 comparisons will make it look as if the metrics of the Asian and European companies are soaring.
Also, if we were to add in all the estimates we have for all the warranty expense non-reporters we have in Asia, we think we could get the continental total up to $42.5 billion by the end of 2019. But we think it could have been over $43 billion in 2018. But let's defer that discussion until next week, when we bring together the reports and estimates for all the various American, European, and Asian auto manufacturers into a global market sizing.