Worldwide Auto Warranty Expenses:
Now that most of the world's automakers publish their warranty expenses in their annual reports, it is possible to tally a global total for the industry. In 2019, claims were up but accruals and reserves were down, as were the number of vehicles sold and the product revenue they brought in worldwide.
In round numbers, the world's automakers spent roughly 2.5% of their product revenue, equivalent to slightly more than $49 billion, on warranty expenses during 2019. By the end of their most recent fiscal year, they had just under $113 billion in their warranty reserves, and were setting aside an average of $539 in warranty accruals per car sold.
Warranty Week is now tracking 23 auto manufacturers around the world who report all or some of their warranty metrics to investors in their annual reports. Most report the amount they pay in claims, the amount they make in accruals, and the amount they hold in warranty reserves. Some report only the amount they hold in warranty reserves at the end of each fiscal year. And a few report that metric along with the amount of accruals they make.
In all of the cases of incomplete reports, we fashion estimates of one sort or another for the missing metrics, allowing us to tabulate a worldwide total for each metric. We also collect data from each OEM on the number of cars sold, and the amount of revenue those product sales bring in, which we use to calculate a claims rate (claims total divided by revenue total) and two types of accrual rates (accrual total divided by revenue total, and accrual total divided by the number of cars sold).
All the data gathering and calculations were done in the native currencies of the OEMs, and then the results were converted into U.S. dollars, using an Internal Revenue Service chart of the yearly average currency exchange rates as our guide. Readers should note that this in and of itself changes the results, as the value of the U.S. dollar rises and falls from one year to the next. However, since we are dealing with OEMs that report in seven currencies (euro, yen, yuan, won, rupees, kronor, and dollars), there really is no other choice that allows us to get them into one chart.
Worldwide Warranty Claims
Actually, there are still too many OEMs for one chart. So what we've done is to break them into smaller groups, and multiple charts. For instance, the worldwide claims totals for the 23 OEMs are broken into two charts: Figure 1a and Figure 1b. The "other" piece in Figure 1a is the sum total in Figure 1b. And the "other" piece in Figure 1b represents the warranty non-reporting OEMs from Japan, China, Iran, Russia, Turkey, and elsewhere.
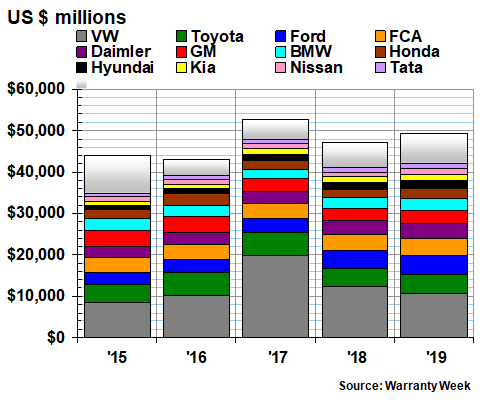
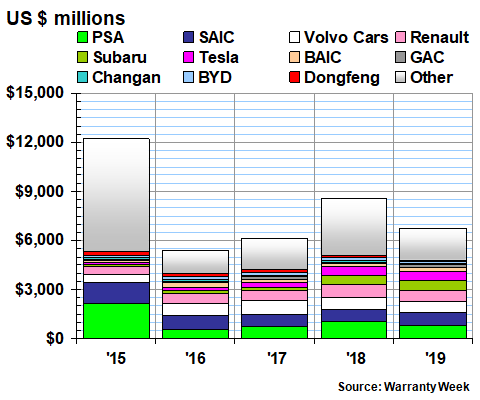
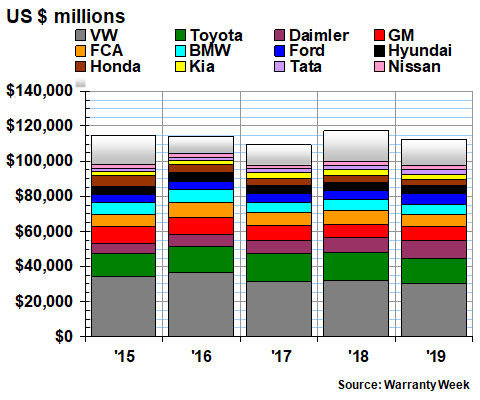
In 2019 we calculate the world's automotive OEMs spent $49.40 billion on warranty claims, up from $47.16 billion in 2018. As far as we can tell, the peak remains the $52.68 billion spent on claims in 2017, the year that Volkswagen AG set a new world record of $19.83 billion in claims paid. But in reality, each OEM took its turn reporting at least one bad year, where claims spiked because of bad ignition switches, floor mats, air bags, or other components.
Figure 1a
Worldwide Auto Manufacturers
Claims Paid per Year
(in millions of dollars, 2015-2019)
We have already delved into the ups and downs of the individual companies in previous newsletters, beginning with the American OEMs on August 20, followed by the European OEMs on August 27, and then the Asian OEMs on September 3. We won't repeat that information again here.
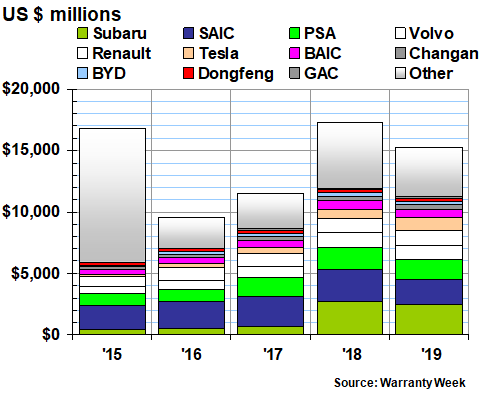
Instead, we will point out that there are twelve OEMs named in Figure 1a, and an additional 11 names in Figure 1b below. The way they fit together is as follows. In Figure 1a, the "other" category in 2019 amounted to $7.28 billion. In Figure 1b, the total adds up to $7.28 billion, with $5.03 billion accounted for by 11 named OEMs, and an additional "other" slide of $2.24 billion accounted for by warranty non-reporters such as Suzuki Motor Corp., Mazda Motor Corp., Mitsubishi Motors Corp., the FAW Group Corp., and others.
In Figure 1a, the claims totals of Kia Motors Corp., Nissan Motor Company Ltd., and Tata Motors Ltd. are barely visible. But they're actually slightly larger than the claims totals of SAIC Motor Corp. Ltd., PSA Peugeot Citroen, and Subaru Corp. listed at the top of Figure 1b. If they were all in one chart, most would be nearly invisible. Plus, we'd run out of unique colors for each of them.
Figure 1b
Worldwide Auto Manufacturers
Claims Paid per Year
(in millions of dollars, 2015-2019)
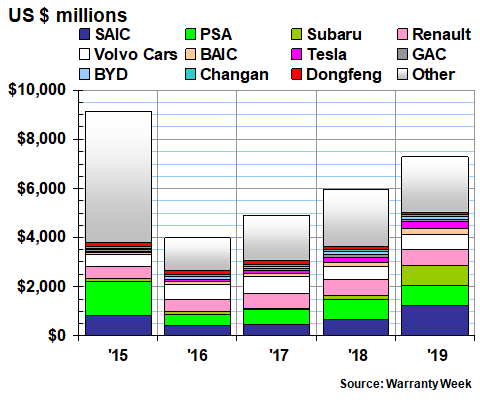
The Chinese OEMs featured prominently on the list of companies that saw the biggest changes in claims paid from 2018 to 2019. On a relative basis, Dongfeng Motor Corp. was number one with a -45% decline in its claims total, followed by Volkswagen with a -14% decline. BYD Company Ltd. was third with a -7.8% decline. Notably, those were the only three OEMs that spent less on claims in 2019 than they did in 2018.
On the increase side, out of the 20 OEMs that saw claims rise, Subaru Corp. topped the list with a jump we estimated to be greater than a quadrupling. SAIC was next with an estimated +86% gain in claims, followed by BAIC Motor Corp. Ltd. at +42%. Ten more OEMs saw claims rise by more than +10% last year, including Daimler, BMW, Honda, and Hyundai.
Five-Year Averages
In Figure 2, we're summarizing the charts included in the past three newsletters for each of the 23 named OEMs by taking a simple average of the claims rates calculated for each over the last five years. VW is highest and SAIC is lowest. As we've stated multiple times, this does not correlate to any sort of measure of quality or reliability, and has more to do with factors such as national accounting standards and how companies in each country report the results of their joint ventures.
Figure 2
Worldwide Auto Manufacturers
Average Warranty Claims Rates
(as a percentage of sales, 2015-2019)
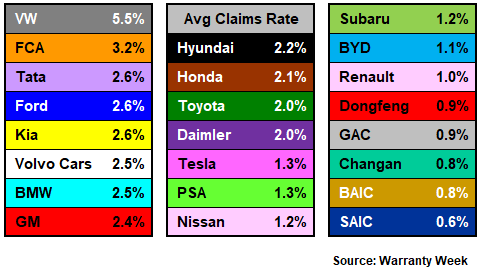
The long-term worldwide weighted average claims rate for all automotive OEMs is just under 2.5% for the years 2010 to 2019. So the eight OEMs on the left are above average, while the seven OEMs in the middle and the eight OEMs on the right are below average. Again, details of the 2015 to 2019 claims rate calculations for each company are included in the past three newsletters.
Worldwide Warranty Accruals
We estimate that the world's automakers accrued $49.28 billion for warranties issued in 2019, slightly less than their cumulative claims payments and $4.54 billion less than they accrued in 2018. As the data in the chart below shows, worldwide accruals have been slightly above or slightly below $50 billion for four years now, after dropping from nearly $67 billion in 2015, which we believe is an all-time record. But again, the fluctuations of the U.S. dollar contribute to these totals as much as the changes for any individual company do.
Figure 3a
Worldwide Auto Manufacturers
Accruals Made per Year
(in millions of dollars, 2015-2019)
From 2018 to 2019, ten OEMs increased their accruals and thirteen cut their accruals. Once again, the Chinese OEMs were found at both the top and bottom of that spread, with the Guangzhou Automobile Group Co. Ltd. (aka GAC) at the very top with a +155% jump, followed by BAIC with a +52% jump. None of those calculations required the use of estimates.
At the other extreme, the Toyota Motor Corp. led the way, cutting its warranty accruals from $5.14 billion to just under $3 billion, a -42% drop. But two Chinese OEMs were close behind, with BYD at -41% and Dongfeng at -40%. Interestingly, both FCA and PSA, which are set to merge later this year, also both cut their accruals significantly last year.
Figure 3b
Worldwide Auto Manufacturers
Accruals Made per Year
(in millions of dollars, 2015-2019)
The raw annual totals for accruals made are one thing. Measuring them as a percentage of sales is something completely different. Even before the pandemic struck, sales were falling around the world. According to OICA, the International Organization of Motor Vehicle Manufacturers, worldwide sales peaked in 2017 at 95.66 million units. Annual sales fell by just 11,000 units in 2018, but then they really took a tumble to 91.36 million units last year.
The reason we mention this is because of the way warranty accruals are determined. A company makes its best prediction of future warranty costs for the products it is making now, and it sets aside that amount as warranty accruals. So if sales are falling, so should accruals, unless the cost per unit is expected to rise.
We measure sales in two different ways: product revenue, and unit sales. So this gives us two ways to measure the rate at which companies are making accruals: as a percentage of revenue, and per unit sold. We've already detailed the accrual rates as a percentage of revenue in the three most recent newsletters, so we will simply summarize those results here. Figure 4 is a simple average of the past five annual readings for the 23 OEMs we're tracking worldwide.
Figure 4
Worldwide Auto Manufacturers
Average Warranty Accrual Rates
(as a percentage of sales, 2015-2019)
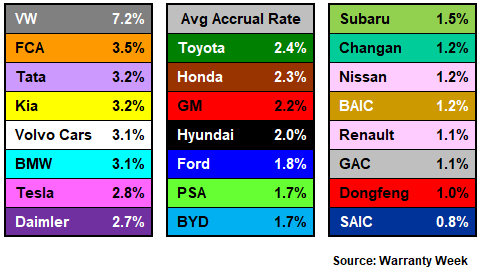
For the decade from 2010 to 2019, the worldwide average accrual rate was just under 2.5% of product revenue on a weighted basis. So most of the group on the left side are above average, while the rest are below average. But compared to Figure 2, there are some significant place changes. Here, Ford and GM are on the left instead of in the middle, and Daimler and Tesla are in the middle instead of on the left. And Nissan moves from the right side to the middle, while BYD moves from the middle to the right.
Accruals Per Vehicle Sold
In Figures 5a to 5c, we are detailing the results of the accrual per vehicle sold calculations across three charts. The average accrual per vehicle sold stood at $539 worldwide last year, down from $542 in 2018. Again, these calculations are all in dollars, so they were all affected by recent fluctuations in exchange rates. In fact, even the American OEMs sell worldwide, so they also had to adjust their accruals to account for changes in foreign exchange rates, though those adjustments are built into their totals.
Back in 2018, Tesla was still accruing an incredible $2,220 per vehicle sold ($544 million in accruals, divided by 245,000 units sold). But in 2019, that metric suddenly dropped to $1,510 per unit, while Daimler's accrual rate suddenly rose by more than $450 per unit to $1,747. So now there is a new number one in the world, for the accruals-per-unit-sold metric, for the first time since Tesla began reporting unit sales in 2012.
Figure 5a
Worldwide Auto Manufacturers
Accruals Made per Vehicle Sold
(in dollars, 2018-2019)
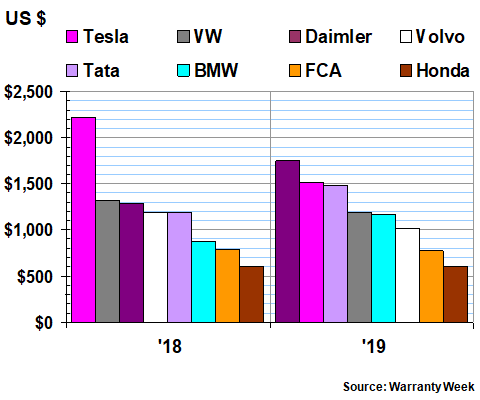
These calculations are affected not only by currency exchange fluctuations, but also by local labor rates, parts costs, shipment costs, and tax rates in each OEM's dominant markets. They also correlate strongly with the underlying price per vehicle, with luxury units always costing more than basic sedans. In other words, high costs per unit don't automatically imply low quality -- they could simply reflect the high cost of warranty work. So it's no surprise to see European luxury brand on this list (and here we'll count Volvo Cars and Jaguar Land Rover as European luxury brands, even though their parent companies are now based in China and India, respectively).
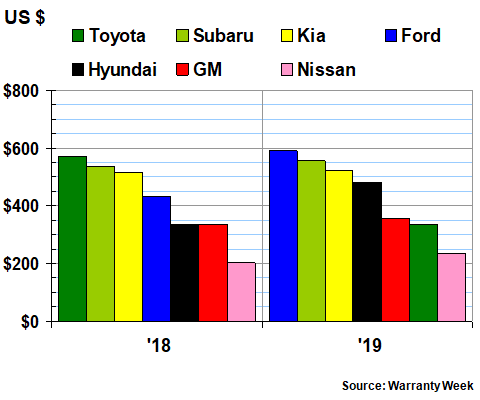
At the other extreme of the chart, Honda's accrual rate per unit sold hardly changed at all: from $600 in 2018 to $609 in 2019. And FCA was down by only $16 per unit sold, to $775. But when we look at the next set of data points, for the seven companies in Figure 5b, we see three really significant changes: Toyota fell from $572 in 2018 to $334 in 2019, while Ford rose from $432 in 2018 to $591 in 2019, and Hyundai rose from $337 in 2018 to $480 in 2019.
Figure 5b
Worldwide Auto Manufacturers
Accruals Made per Vehicle Sold
(in dollars, 2018-2019)
And then when we look at the last eight companies in Figure 5c, we see BYD down by $112 per unit and PSA down by $52 per unit. Renault was up by $26 per unit. Further down, we tend to question the output of our out-of-warranty desktop calculator, wondering for instance how Dongfeng can report 603 million yuan in accruals and 2.93 million units sold (which equates to just $29.76 per unit if we assume 6.91 yuan to the dollar).
Figure 5c
Worldwide Auto Manufacturers
Accruals Made per Vehicle Sold
(in dollars, 2018-2019)
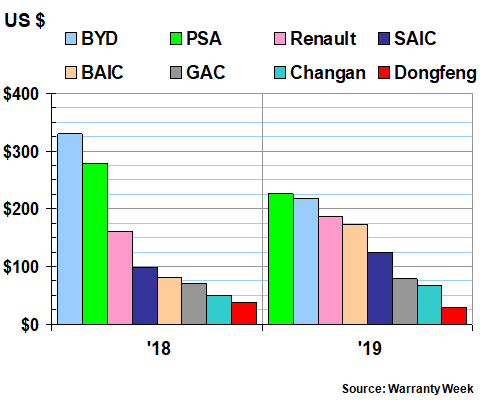
As was mentioned, we think the problem is the way that the results of the many joint ventures in China are reported by the respective partners. They may be double-counting the units sold and the revenues, but apportioning the warranty expenses correctly between the partners, with no overlap. If this is the case, however, it's actually reassuring, because that would mean there is no double-counting of the warranty expenses, and the worldwide totals tabulated here would be accurate. It's the unit sales and revenue that we'd have to fix, along with the rate calculations based on those metrics.
Worldwide Warranty Reserve Totals
Our final warranty metric is the balance reported in the warranty reserve funds of the 23 automotive OEMs at the end of each of their past five fiscal years. We should note that Toyota, Honda, Nissan, Subaru, and Tata end their fiscal years on March 31, while most of the others end on December 31. That usually doesn't matter much, except in this latest year, when the Japanese and Indian companies had three more months to react to the pandemic and the sales tumble it caused.
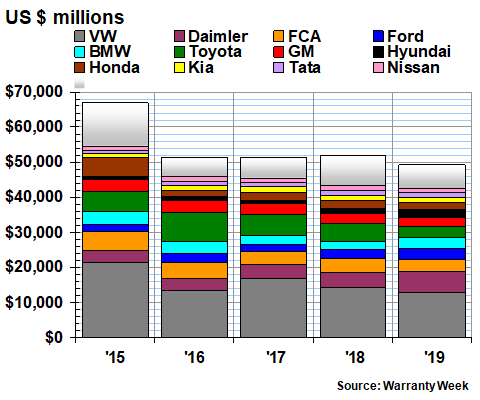
In Figure 6a, the worldwide warranty reserve total stood at $112.76 billion at the end of fiscal 2019, down from $117.34 billion at the end of fiscal 2018. And as far as we can tell, that 2018 figure represents the all-time record for the industry.
Figure 6a
Worldwide Auto Manufacturers
Reserves Held At Year's End
(in millions of dollars, 2015-2019)
On a dollar basis, the biggest drops were the -$1.73 billion calculated for VW and the -$1.29 billion calculated for Toyota. The biggest jumps were the +$1.43 billion reported by Daimler and the +$565 million reported by Ford.
On a percentage basis, however, there were some even larger changes. SAIC cut its reserve balance by -22%, and PSA cut its total by -14%. And then both Tesla and GAC boosted their warranty reserve balances by +46%.
As with the claims and accrual totals above, we are presenting the reserve balances in two charts. The "other" segment in Figure 6a corresponds to the totals in Figure 6b, and the "other" segment in Figure 6b represents all the warranty non-reporting OEMs around the world.
Figure 6b
Worldwide Auto Manufacturers
Reserves Held At Year's End
(in millions of dollars, 2015-2019)
There are actually 29 automotive OEMs reporting at least the balance in their warranty reserve funds at the end of each year. So our estimates are not required for them, at least for this warranty metric, and even most of the "other" category is based on reported numbers. On a worldwide basis, depending upon the year, we estimate that 87% to 96% of the entire industry's claims, accruals, and reserves were included in the annual reports of these automotive OEMs, requiring only a small portion of the worldwide totals to be estimated.
Low Need For Estimates
In these charts, for instance, estimates were uncommon. In Figures 6a and 6b, out of the 115 reserve measurement data points (23 OEMs x 5 years), only one entry is an estimate (Changan did not report its balance in 2019). Out of the 115 accrual measurements, none of the 60 data points in Figure 3a are estimates and only five of the 55 included in Figure 3b are not based on figures reported by the manufacturers themselves.
The trend is towards universal reporting. In recent years, only Subaru, Changan, and SAIC have reduced the number of warranty metrics they report, while BYD, GAC, and BAIC are among those that have increased their warranty metric reporting. And the top 10 OEMs have reported every warranty metric we use every year: claims, accruals, and reserves.
Next year's report is likely to look very different than this year's, however. First, there will be a massive decline in sales, related to the pandemic's persistence. Second, as we saw in 2009, nervous customers and impoverished dealers will not let claims decline by much, though accruals will decline proportionally to sales. And third, the FCA-PSA merger may be only the first of several, as the financial turmoil continues.