U.S. New Home & RV Warranty Report:
Last time, the recession hit these industries hard. This time, there's been an impact, but not as severe, at least when looking at their warranty metrics. RV sales have tanked again, but new home sales are actually rising, even in the midst of the pandemic lockdowns and the work-at-home mandates.
During the last recession, two of the industries most impacted by the economic downturn were the passenger car manufacturers and new home builders. But the one that really suffered the most was a hybrid of the two: manufacturers of recreational vehicles and mobile homes.
Numerous RV and mobile home manufacturers simply went out of business, leaving their customers without product warranties and their dealers stuck with inventory nobody wanted. Some dealers resorted to paying the premiums for extended warranties that they could then give away to buyers. But the basic problem was that the banks were in no position to lend, and few customers had a quarter-million at their disposal.
In the current recession, the basic problem is health. Any time two or more unrelated people get together, there's a chance that one might pass the virus onto another. The banks are fine and the products are ready, but nobody wants to go shopping.
Yet in an unlikely turn of events, many people are now coming to prefer life in the suburbs or in a rural setting. Long commutes to work? Nobody's going to the office any more. Lack of socialization or cultural events? Netflix and Zoom can bridge that gap.
Warranty Metrics
So perhaps it will come as no surprise that the site-built home industry whose warranty expenses we track has seen a 5.0% increase in unit sales, from the second quarter of 2019 to the second quarter of 2020. The publicly-held homebuilders whose warranty expenses we follow sold 59,000 homes in the year-ago quarter and nearly 63,000 in the months of April, May, and June 2020.
New home revenue was up 3.1%, suggesting a bit of price erosion. But the main point is that in a quarter where tens of millions of people lost their jobs and hundreds of millions of people remained in their homes, nearly 63,000 families bought a new home.
On the other hand, recreational vehicles and mobile homes seem to have reverted to the old pattern. We don't track unit sales in that industry, but we do track revenue. And product revenue was down almost 26% in the second quarter, which is more in keeping with the pattern we saw in the passenger car industry (GM down -59%; Ford down -54%, etc.).
Since early 2003, we have tracked 54 builders of site-built homes and 12 manufacturers of modular homes, mobile homes, and recreational vehicles. From each of their annual reports and quarterly financial statements, we extract figures for three warranty metrics: the amount of claims paid, the amount of accruals made, and the balance in the warranty reserve fund at the end of the period.
We also collect data for three additional non-warranty metrics: from the site-built home companies, the amount of home closing revenue (no land-only sales or mortgage income) and the number of units sold. From the mobile home and RV companies, we collect figures for product sales revenue.
We then divide the claims and accrual totals by home closing revenue or product revenue to calculate the percentage of sales going towards paying claims (the claims rate) or making accruals (the accrual rate). And for the site-built homes, we also calculate a second kind of accrual rate, by dividing the accrual total by the number of units sold, which gives us a figure, in dollars, for accruals per home sold.
Warranty Claims Totals
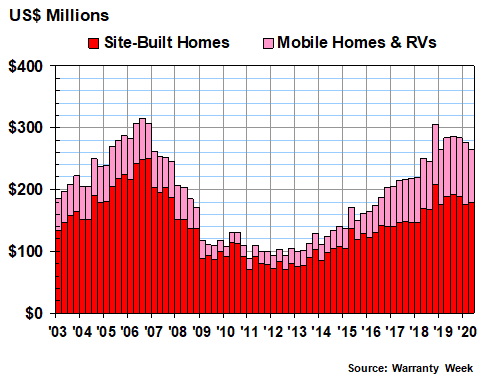
In Figure 1, we're detailing the amount of claims paid by the site-built home and mobile/RV companies over the past 17-1/2 years, or 70 quarters. Not all of the companies we started out with are still with us, and some such as Taylor Morrison Home Corp. and the Rev Group Inc. have joined the list more recently. We have estimated that the site-built home companies on our list represent about a third of the total industry (the rest are either privately-held or they do not reveal their warranty expenses for other reasons). We don't know what share of the total market our RV/mobile home companies have.
In the first quarter of 2020, the site-built home companies spent $176 million on claims while the RV and mobile home manufacturers spent $100 million on claims. Both were up from year-ago figures.
In the second quarter of 2020, the site-built home companies spent $179 million on claims while the RV and mobile home manufacturers spent $86 million on claims. Both were down from year-ago figures.
For the first half of 2020, the site-built home companies spent $355 million on claims, down by about $10 million or -2.7%. The RV/mobile home companies spent $187 million on claims during the same six months, and that was actually up by $1.5 million or +0.8%.
The chart looks a bit like two mountains with a valley in between. Look closer and you'll see that claims peaked in late 2006 and in late 2018 -- long before anyone was seeing a recession in the future.
Figure 1
New Homes & RVs
Claims Paid by U.S.-based Builders
(in US$ millions, 2003-2020)
The companies that saw their claims payments rise the fastest during the first six months of 2020 included LGI Homes Inc.; New Home Co. Inc.; Taylor Morrison Home; Toll Brothers Inc.; and Winnebago Industries Inc.
The companies that saw their claims payments fall the fastest during the first half of 2020 included Beazer Homes USA Inc.; Century Communities Inc.; Meritage Homes Corp.; NVR Inc.; and the Shyft Group Inc. (formerly Spartan Motors).
Warranty Accrual Totals
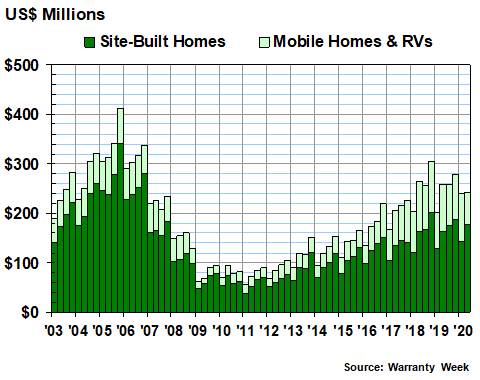
Unlike warranty claims, the totals for warranty accruals also seem to vary by season. Within any given calendar year, accruals always seem to be highest at the end and lowest at the beginning. No doubt, this has something to do with the selling season for new homes, which on a units-sold basis also seems to be lowest in the winter and highest in the fall.
Accruals should always remain proportional to sales, unless there's been a noticeable change in product quality or the average cost of repair. In some years, the added expenses of dealing with mold or sub-standard drywall have temporarily raised warranty expenses. But some builders have managed to keep their accruals nearly exactly proportional to sales revenue.
In Figure 2, the mountain range looks a little different, with the peaks higher to the left and lower to the right. And the timing is different as well. Accruals peaked at the end of 2005, then again at the end of 2018. The timing for the bottom of the valley is different also: 2009 to 2011 for accruals, and 2011 to 2013 for claims.
And that's the way it should be. When sales begin to decline, manufacturers cut accruals proportionally. But claims continue to come in, from units sold in previous good years. Accruals will usually bottom out first, and claims will lag behind by a year or two.
Figure 2
New Homes & RVs
Accruals Made by U.S.-based Builders
(in US$ millions, 2003-2020)
Amazingly, we found only five companies that cut their accruals during the first half of 2020: New Home Co.; NVR; Shyft Group; Skyline Champion Corp.; and Thor Industries Inc. The Shyft Group cut its accruals the most: from $5.7 million in the first half of 2019 to only $1.4 million in the first half of 2020. But its sales fell by -38%, so that's not a shock.
The rest saw their accrual totals rise, and some did so dramatically. In terms of fastest increases, the top five were LGI Homes; Rev Group; Taylor Morrison Home; Toll Brothers; and Winnebago.
None of the RV or mobile home manufacturers reported a sales increase, but Winnebago boosted its accruals from $23 million in 2019 to $29 million in 2020, and Rev Group raised accruals from $9.2 million to $15 million. They saw sales fall -24% and -5%, respectively.
Meanwhile, Toll Brothers saw sales decline by -11%. But LGI saw sales rise +4%, and Taylor Morrison saw sales rise +19%. In fact, Taylor Morrison was one of eight site-built home companies to see sales rise by +10% or more at the midpoint of 2020. And in terms of fastest sales gain, it was in fifth place, with sales at Century Communities; Hovnanian Enterprises Inc.; M.D.C. Holdings Inc.; and Meritage Homes rising by +20% or more. Yes, you read that right: four new home builders reported sales gains of 20% or more in the middle of a pandemic-triggered recession.
Warranty Reserve Totals
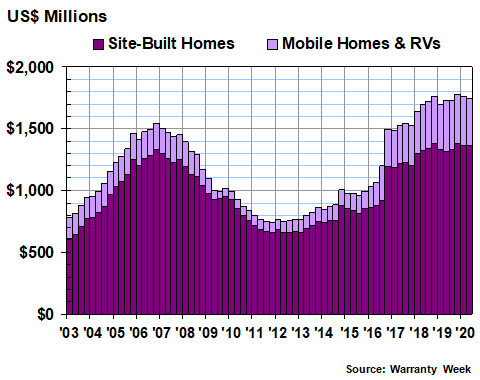
In Figure 3 we're looking at the closing balance in the warranty reserve funds of the homebuilders and RV makers. The mid-year balance for both groups together rose slightly from $1.73 billion to $1.75 billion, a 1.1% gain. But the two groups went in opposite directions. For site-built homes, the balance rose from $1.32 billion to $1.37 billion, while for the RV/mobile home makers, the balance fell from $408 million to $381 million.
Figure 3
New Homes & RVs
Reserves Held by U.S.-based Builders
(in US$ millions, 2003-2020)
The warranty reserve balance is the product of not only claims and accruals, but also acquisitions, divestments, and other adjustments. And so it stands to reason that a company such as Shyft Group, which radically cut its claims and accruals this year, would also be at the top of the list for reserve declines ($17 million to $5.3 million, -69%).
But there were others that were even larger in dollar terms, though not in percentages. Toll Brothers cut its reserve balance from $224 million to $157 million, and Thor cut its balance from $299 million to $258 million.
At the other extreme, Taylor Morrison increased its reserves from $81 million to $117 million, while Winnebago raised its balance from $44 million to $61 million, and Rev Group increased its reserves from $25 million to $32 million. But the biggest increase of all, at least in dollar terms, was reported by D.R. Horton Inc., which boosted its reserves from $229 million to $281 million.
New Home Warranty Expense Rates
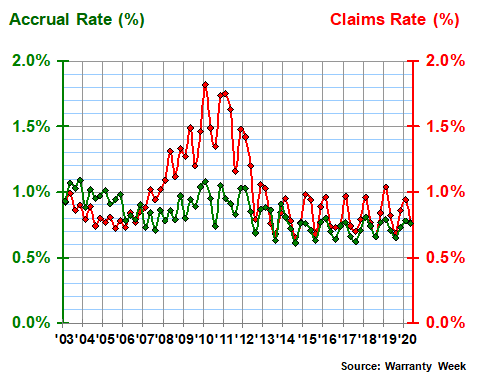
The next three charts detail some calculations we've made by dividing one metric by another. In Figures 4 and 6, we're taking the claims and accrual data from Figures 1 and 2 and dividing each by sales revenue. In Figure 5, we're dividing the site-built home accruals by the number of homes sold, to calculate how much money the builders accrued per unit sold.
The most striking feature of Figure 4 is the single peak in the claims rate data, which tops out at 1.8% in early 2010. What's also striking is what's not there: another more recent peak, for this recession. In fact, while the claims rate data also seems to have its own seasonal pattern, the two data points recorded so far in 2020 are about 0.1% lower than the same two in 2019.
That should not be happening. From 2005 to 2010, claims rates rose swiftly, while accrual rates rose gradually. But from 2018 until now, nothing much is happening at all.
Figure 4
New Site-Built Home
Average Claims & Accrual Rates
(% of revenue, 2003-2020)
The other metric we have at our disposal is the average amount of accruals set aside by the homebuilders every time they close a sale. In the second quarter of 2020, that amount was $2,747, up a bit from the $2,637 we calculated a year before. Accruals per unit in the first quarter were $2,552, down by about $15 from the levels of early 2019.
Figure 5
New Site-Built Homes
Average Warranty Accrual Rates
(US$ accrued per unit, 2003-2020)
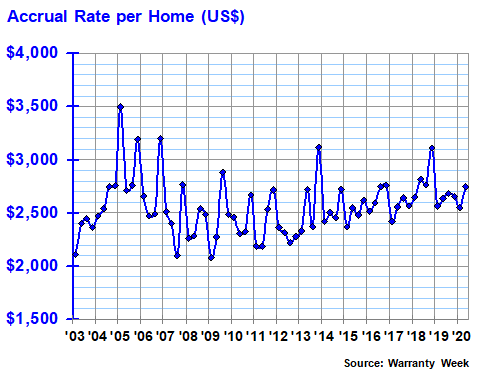
The long-term average is $2,559, which is just above the first-quarter average. But it's been as high as $3,498 (in early 2005) and as low as $2,079 (in early 2009). From one year to the next it's risen by more than $1,000 (from early 2004 to early 2005). And it's varied by $600 or more up or down seven times in consecutive quarters. So the current readings are pretty average.
RV & Mobile Home Expense Rates
In Figure 6, we're looking at the 17-1/2-year record for the RV and mobile home manufacturers. Had it not been for that one-quarter-long spike in early 2009, the data would look fairly ordinary. But in that one quarter, the All American Group Inc. saw its claims rate spike to an astounding 21%, while Fleetwood Enterprises Inc. would see its claims rate spike to 6.0%. By 2010, both were gone, as were Featherlite Inc.; Monaco Coach Corp.; National R.V. Holdings Inc.; Rexhall Industries Inc.; and Kingsley Coach Inc.
Figure 6
Mobile Homes & RVs
Average Claims & Accrual Rates
(% of revenue, 2003-2020)
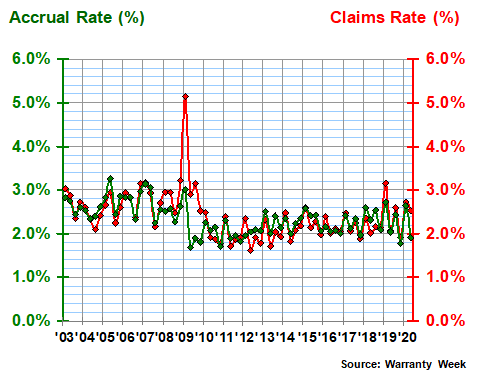
Among the survivors, the claims rate is just a bit above the long-term average of 2.4%, while the accrual rate is about half a percentage point below the 2.4% long-term average for this group. Thor and Winnebago are a bit above average, while Shyft and Rev Group are a bit below average. Skyline Champion is right about at the average level.
Yet, as we saw in last week's newsletter, the only RV manufacturer to make any of the top 10 lists was Rev Group, for its rising accrual rate. In contrast, among the site-built home companies, Toll Brothers made two of the "bad" lists (for rising claims and accrual rates), while NVR and Meritage both made one of the "good" lists (for their declining claims rates). Nine other homebuilders in the top 100 made no top 10 lists at all, meaning their warranty metrics didn't change by enough to set them apart.
In other words, what we're not seeing in the warranty data is the wild spikes that came with plummeting sales the last time around. We're not even seeing the plummeting sales, except for the RV manufacturers. And that's to be expected. This was not the summer for a road trip. Instead, it was the year people moved out of the cities to their summer homes, or they bought one, or they built one to live in year-round, or at least until they think it's safe to return to those crowded cities and cramped office towers.