US Automotive OEM & Supplier Warranty Report:
Because of the way their warranties are structured, car manufacturers have the highest warranty costs and their suppliers have the lowest. Truck manufacturers and their engine suppliers, however, have much closer expense rates. But the pandemic seems to have upset these patterns considerably.
In troubled times, warranty metrics seem to get a bit unsteady. In the automotive business during the first year of the pandemic, for instance, sales dove but claims didn't, and a good deal of warranty accruals got time-shifted from earlier to later in the year.
Since early 2003, we have collected warranty metrics from the annual reports and quarterly financial statements of some 170 different U.S.-based companies engaged primarily in the manufacture of vehicles and parts. Roughly 24 are engaged in the manufacture of cars and other small vehicles such as motorcycles and golf carts. Roughly 26 make trucks, buses, recreational vehicles, and all sorts of large vehicles used in activities such as farming, construction, and mining. And then roughly 120 make parts and components used by these automotive OEMs, of which 24 specialize in the manufacture of powertrain components such as engines and transmissions.
From each company's financial statements, we collected three warranty metrics: the amount of claims paid, the amount of accruals made, and the amount of warranty reserves held. We also collected data on product sales, which we used to calculate claims as a percentage of sales (the claims rate) and accruals as a percentage of sales (the accrual rate).
In recent newsletters, we have detailed the individual warranty metrics of some of the largest manufacturers in the business, so we won't repeat a lot of that here. But we note that this might be one of the last times we ever get to mention truck and bus manufacturer Navistar International Corp. as an independent company, because it is heading towards an acquisition by the Traton Group, a subsidiary of Volkswagen AG.
OEM Claims Totals
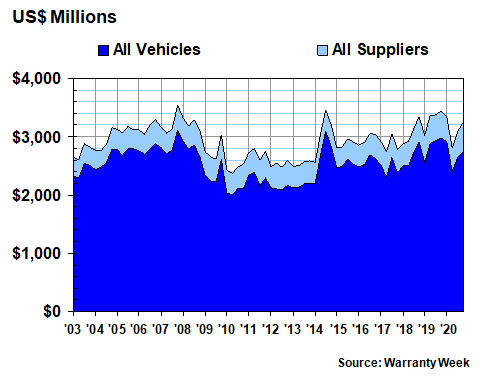
In Figure 1 we are detailing the quarterly totals for claims paid by the 50 automotive OEMs over the past 72 quarters, or 18 years. Typically, the U.S.-based car and small vehicle manufacturers pay out roughly two to three times as much per quarter as do the truck and large vehicle makers, but on occasion this ratio has risen to four or even five times as much.
In 2020, the small vehicle makers paid $7.52 billion in claims, down $652 million or -8.0% from 2019 levels. The large vehicle makers paid $3.20 billion in claims last year, which was actually up by $27 million or +0.9% from 2019.
In general terms, there appears to be three phases in the data below. From 2003 to 2008, warranty claims totals generally rose, peaking at the end of 2007. And then from 2009 to 2013, warranty claims remained low, as companies and customers recovered from the Great Recession. And then in 2014, beginning with General Motors Company's ignition switch recalls, claims bounced back to their former heights, until the lockdowns began last year.
Figure 1
Automotive OEM Warranties
Claims Paid by U.S.-based Companies
(in US$ millions, 2003-2020)
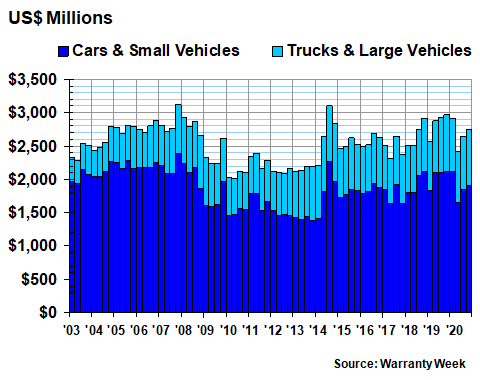
Notice in the chart above how deep the decline was in the just second quarter of 2020. During those three months, in which the pandemic lockdowns were at their height, small vehicle makers paid out just $1.65 billion in claims, while large vehicle makers paid out only $759 million. For the 24 small vehicle makers, it was their lowest quarterly total since the end of 2017, while for the 26 large vehicle makers, it was their lowest since the start of 2019.
Supplier Claims Totals
Now let's take a look at the claims totals reported by the automotive suppliers. As was mentioned, we divide the list of 120 suppliers into two parts: the 24 that make primarily powertrain components, and the 96 that make other parts and components.
Like the OEMs who are their ultimate customers, the suppliers saw claims fall steeply during the second-quarter lockdowns. But unlike the OEMs, these suppliers ended 2020 paying more per quarter than ever before. Powertrain suppliers paid $309 million in claims that quarter, while other parts suppliers paid $199 million. For the powertrain suppliers, it was a new record quarterly high.
Figure 2
Automotive Supplier Warranties
Claims Paid by U.S.-based Companies
(in US$ millions, 2003-2020)
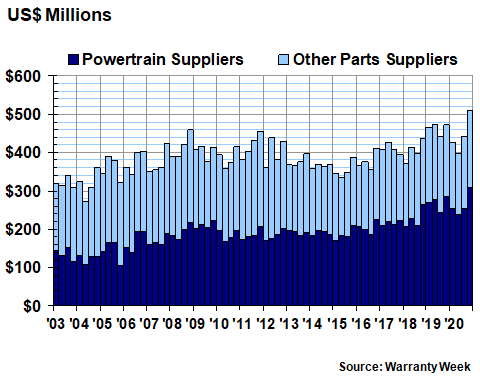
It appears, however, that what actually happened during 2020 was a bit of time-shifting for the settlement of claims from early in the year to later in the year. For the year as a whole, claims were actually down for both groups of suppliers. Claims fell by $22 million or -2.0% to $1.05 billion for the powertrain group in the entirety of 2020, while claims fell $58 million or -7.4% to $722 million for the other parts suppliers last year.
Warranty Accrual Totals
We wanted to quickly detail the warranty accrual totals of these four groups of automotive manufacturers, because once again we have already highlighted some of the trends seen here in previous newsletters, such as the reports on the carmakers, the truck and heavy equipment manufacturers, and the recreational vehicle makers. But it's clear that both the second-quarter notch is present here, as is the fourth-quarter spike in last year's data.
Figure 3
Automotive OEM & Supplier Warranties
Accruals Made by U.S.-based Companies
(in US$ millions, 2003-2020)
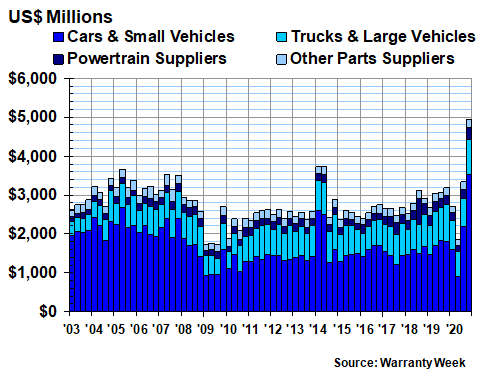
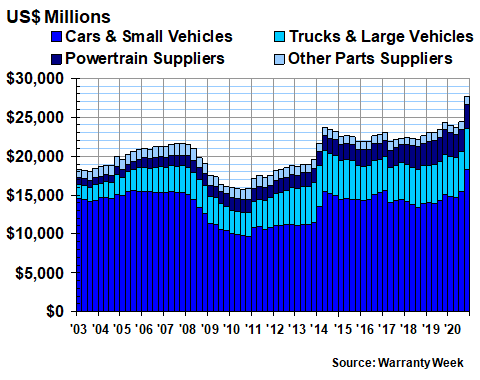
For all 170 companies in all four groups, warranty accruals dropped to just $1.86 billion in the second quarter of 2020 -- their lowest level since the depths of the Great Recession in 2009. And then in the fourth quarter, accruals rose to $4.93 billion for the U.S.-based portion of the automotive industry -- their highest level ever. Surely, some of that is simple time-shifting, although some major players such as Ford Motor Co. and Cummins Inc. continue to battle against high warranty expense levels.
For the year as a whole, warranty accruals were up by $849 million or +7.1% to $12.827 billion, but that increase was caused entirely by the small vehicle makers. That group saw accruals grow +21% to $8.227 billion. Truck makers cut accruals by -12% to $2.992 billion. Powertrain suppliers cut accruals by -11% to $890 million. And other parts suppliers reduced their warranty accruals by -6.9% to $718 million.
Warranty Expense Rates
The claims and accrual data in Figures 1 through 3 can also be looked at a different way. Using product sales data, we can calculate the percentage of revenue being paid out in claims, and being set aside as accruals. But because this is a moving average of both sales and expenses, it does some unusual things in exceptional times.
During recessions, sales usually fall faster than claims, so the claims rate usually spikes, as it did during 2009 and again in 2020, if you look at the red line in the chart below. And then, during spikes in recall activity, as happened with the GM ignition switches in 2014, and as is apparently happening again towards the end of 2020, the green line that follows the accrual rate can spike.
Figure 4
Small Vehicle Makers & Other Parts Suppliers
Average Warranty Claims & Accrual Rates
(as a % of product sales, 2003-2020)
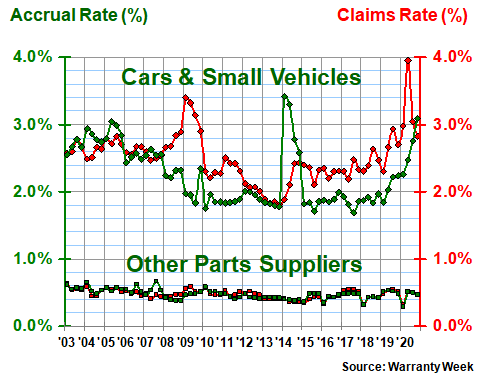
At the start of 2009, as sales dried up, small vehicle makers saw their claims rate spike to 3.4%. And then in the second quarter of 2020, as the lockdowns took hold, their claims rate rose to just under 4.0%. In early 2014, carmakers saw their accrual rate rise just above 3.4%. And then in the fourth quarter of 2020, it rose to 3.1%.
Long term, the average claims rate of the small vehicle makers is 2.5%, while their average accrual rate is 2.2%. Both have a standard deviation of 0.4%, which is caused by the multiple spikes they've seen in tough times.
The other parts manufacturers, meanwhile, have kept close to their 0.5% average claims and accrual rates over the past 18 years, with a standard deviation of only 0.07%. Their expense rates actually took deep dives at the start of 2016, 2018, and 2020, but again, they seemed to be merely time-shifting expenses from earlier and later quarters. Long-term, the rates have been fairly stable.
Balance Between Sales and Accruals
Sales rates are the unseen factor in these calculations. Usually, or at least in normal times, sales and accruals move in the same direction, and remain proportional to each other, so the accrual rates never change that much. But when manufacturing problems arise, or when safety recalls spike, they diverge and the accrual rate becomes unstable.
Among suppliers, for instance, sales and accruals remained more or less proportional throughout the pandemic. When sales slowed, accruals were reduced, so the accrual rate didn't change all that much. In 2020, for instance, powertrain suppliers saw product sales fall -16%. And they cut their accruals by -11%, which led their average accrual rate to rise slightly above its typical one percent level.
Other parts suppliers were even more exact. Their sales fell -8.0%, and they cut their accruals by -6.9%. Accrual rates hardly changed. Truck and bus manufacturers saw their sales fall by -19%. But they cut their accrual totals by only -12%, so their average accrual rate rose a bit above its typical two percent level.
It was among the car and small vehicle manufacturers that the biggest disconnect occurred. For the year as a whole, product sales revenue was down -12%, though it was down much more in the second quarter. But warranty accruals, which also plummeted in the second quarter, spiked significantly in the fourth quarter, and were up a dramatic +21% for the year. That caused the sudden year-end spike in accruals that we can see in Figures 3 and 4.
Truck and Powertrain Expense Rates
In the automotive industry, the makers of small vehicles (up to perhaps the size of an SUV or a pickup truck) tend to be responsible for the warranty of the entire vehicle -- the so-called bumper-to-bumper manufacturer's warranty. But in the truck and bus industries, manufacturers tend to issue separate warranties to the end user customer for the chassis, engine, transmission, and other major components.
Therefore, in Figure 4, the OEMs at the top are the customers of the suppliers at the bottom. And since all companies are reporting their net expenses, one company's payment is another company's reimbursement. But in Figure 5, the truck and bus OEMs at the top issue their own warranties to their end user customers, while the powertrain manufacturers at the bottom then issue their own separate warranties to their end user customers.
The reason we mention this is because it explains why the line pairs in Figure 5 and closer together than the line pairs in Figure 4. Plain and simple, bumper-to-bumper warranties are more expensive than separately-warranted components, because there's more friction between OEMs and suppliers than there is between dealers and warranty providers. Or to put it another way, it's easier for the repair organization to collect from a manufacturer than it is for one manufacturer to collect from another manufacturer.
Figure 5
Large Vehicle Makers & Powertrain Suppliers
Average Warranty Claims & Accrual Rates
(as a % of product sales, 2003-2020)
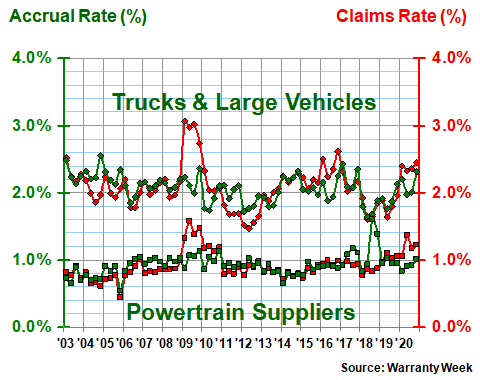
In Figure 4, the average gap between the line pairs is 1.8% for the accrual rates and 2.0% for the claims rates. In Figure 5, the average gap between the accrual rates is 1.1% while it's 1.2% for the claims rates. And note that in the third quarter of 2019, one of the lines actually crossed, as Cummins dealt with its engine emissions warranty problems, and as OEMs enjoyed a brief dip in their expense rates.
Further Details on the Gap
In Figures 6 and 7, we want to reassemble the claims data to illustrate another way of looking at the gap between OEMs and suppliers. In Figure 6, we're adding the car and truck claims data together to create a new "all vehicles" category, and we're adding the powertrain and other parts supplier data together to create a new "all suppliers" category. It's the same data as in Figures 1 and 2, but now it's in a single chart.
Figure 6
Automotive OEM & Supplier Warranties
Claims Paid by U.S.-based Companies
(in US$ millions, 2003-2020)
Now imagine that instead of measuring claims in dollars, we measured it as a percentage of the total. In other words, during the fourth quarter of 2020, the car and truck OEMs paid $2.743 billion in claims, while the powertrain and other suppliers paid $508 million in claims, for a total of $3.251 billion in claims for the entire industry.
But what is we instead measured it in percentages of the total? Therefore, that $2.743 billion would represent 84% of the total, while that $508 million would represent the remaining 16%. Put another way, OEMs paid 84% of the claims that quarter, while suppliers paid 16%.
If we did that for each of the 72 quarters between 2003 and 2020, we'd end up with something that looks like Figure 7. Once again, it's the same data as in Figures 1 and 2, but it's displayed in a different format, with percentages of the total replacing dollar amounts.
What this shows is that for a short time in 2004, the OEMs' share of claims briefly surpassed 90%, and it came close to that mark in 2005 and again in 2014. But their share also dipped below 83% of the total for a short time in 2012, and came close to doing so in 2011.
Figure 7
Automotive OEM & Supplier Warranties
Claims Paid by U.S.-based Companies
(as a percentage of the total, 2003-2020)

Over the long term, the OEMs have paid an average of 86.7% of the industry's claims, which is almost in the middle of that 83% to 90% range. And within any given year, it can be both above and below that average level, as it was in 2020 (slightly above it in the first quarter, and below it for the rest of the year).
The reason it exists at all is the friction that frequently occurs between manufacturers when an OEM seeks reimbursement from a supplier, or when one supplier seeks a reimbursement from another supplier. In a perfect world, the OEMs might be paying only 75% or 80% of the claims, if supplier recovery efforts were as routine and efficient as are the warranty work payments to dealers and other repair service providers.
Warranty Reserve Balances
We have one more warranty metric to detail for you today, and that is the ending balance in the warranty reserve funds of the 170 automotive manufacturers we're tracking in this week's newsletter. As can be seen in Figure 8 below, those balances hit a new high of $27.7 billion at the very end of 2020 -- more than $3.3 billion higher than they were at the end of 2019 and nearly $4.0 billion higher than they were in the middle of 2014.
Figure 8
Automotive OEM Warranties
Reserves Held by U.S.-based Companies
(in US$ millions, 2003-2020)
Again, that record-setting pace arose almost completely from the actions of the car and small vehicle makers, primarily Ford. That company alone accounted for $2.47 billion out of the $3.24 billion increase reported by all 24 of the car and small vehicle makers last year. And for the year as a whole, Ford's warranty reserve balance rose by +43% while the car and small vehicle makers were up by +22%.
Meanwhile, both the truck and large vehicle makers and the powertrain suppliers increased their warranty reserve balances by almost imperceptible amounts last year. The truck and bus makers grew their reserves by +0.4% to $5.25 billion, while the powertrain suppliers grew their reserves by +0.3% to $3.13 billion, compared to the end of 2019. The other parts suppliers grew their reserves by +4.3% to $1.036 billion.