New Home & Building Materials Warranty Report:
What you won't see in this week's collection of warranty expense reports are soaring or plunging warranty metrics. Most of the building trades' warranty expenses were fairly stable in 2020, with those metrics generally rising or falling by 10% or less. But just as there are exceptions to every rule, there were also a handful of big moves up and down last year.
While the U.S.-based vehicle industry had an awful time getting through the pandemic and the lockdowns that followed, and the U.S.-based electronics industry continues to lose share to imports, some portions of the U.S.-based building trades actually did fairly well in an otherwise forgettable year.
Warranty expenses are never good, but it's bad when the reasons for their declines are either their customers' inability to get out to buy or their repair technicians' inability to get to the customer. We saw a bit of both in the building trades last year, but by year's end things had more or less leveled out. For instance, for all of 2020, appliance and HVAC manufacturers saw just a +1.2% increase in warranty claims, while building materials suppliers posted just a -1.2% decline in warranty accruals.
We began with a list of 280 U.S.-based companies that are engaged in the building trades and that publish their warranty expense reports in their annual reports and quarterly financial statements. Of those companies, 55 are builders of new homes; 114 are suppliers of building materials, fixtures or furniture; 66 manufacture household or foodservice appliances and/or commercial and residential heating, ventilation and air conditioning systems; and 45 manufacture electrical power generating equipment, including both utility-grade and rooftop solar installations.
From each company's financial reports, we extracted three warranty metrics: the amount of claims paid, the amount of accruals made, and the amount of reserves held. We also compiled the corresponding product revenue figures, which we used to calculate the percentage of revenue going towards paying claims (the claims rate) and the percentage of revenue going towards making accruals (the accrual rate).
Warranty Claims Totals
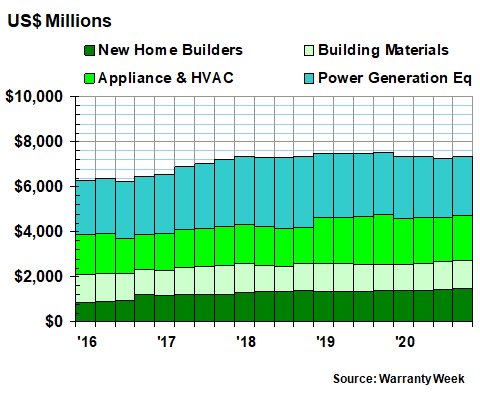
To better illustrate recent trends in these industries, we are charting just the past five years of data, although the database goes back to early 2003. In Figure 1, we are looking at the quarterly totals for claims payments by these 280 companies, grouped into four industries.
Figure 1
Homebuilding & Materials Warranties
Claims Paid by U.S.-based Manufacturers
(in US$ millions per quarter, 2016-2020)
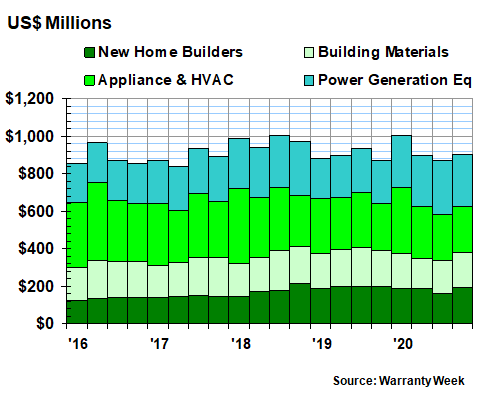
The big surprise is that these companies paid the most claims of the last five years in the first quarter of 2020, narrowly beating out the third quarter of 2018. And that, in turn, was the highest quarterly claims total for these industries since 2010.
Claims totals fell in the second quarter of 2020, and fell again in the third quarter of last year. But they rose slightly in the fourth quarter. It was the exact opposite of the pattern seen in 2019.
Comparing the same quarters of each year also produces mixed results. The claims total for all four industries rose +14% to $1.007 billion in the first quarter; fell -0.5% to $896 million in the second quarter; fell -6.8% to $873 million in the third quarter, and gained +3.3% to $904 million in the fourth quarter.
However, within those results, different industries had different patterns. For the building materials companies, every quarterly claims total was down last year from their 2019 totals. But for the power generation equipment companies, every quarter was up.
The appliance and HVAC companies were covered in detail in the April 22 newsletter and the homebuilders were the subject of the March 11 newsletter, so we won't repeat too much here. But the appliance and HVAC makers had a big up in the first quarter and a big down in the third quarter, while the homebuilders had a big down in the third quarter.
For the year as a whole, the appliance and HVAC companies took the top spot with a $1.127 billion claims total, up $13 million or +1.2%. The power generation companies had the fastest growth in claims payments at +22%, and the second-highest total at $1.116 billion last year. The new home builders were third with $730 million, down -6.8%, and their building material suppliers were down -10% to $708 million.
All four industries together paid out $3.681 billion in claims last year, which was $84 million or +2.3% more than they paid in 2019. But claims payments were $234 million higher in 2018, and were much higher in the years 2006 to 2008.
Warranty Accrual Totals
Warranty accruals also peaked long ago for this group of 280 companies. As with warranty claims, the years 2006 to 2008 were the biggest years, while 2018 saw the top annual accrual total of the last five years ($3.842 billion). In 2019, the groups' accruals fell to $3.667 billion, and in 2020 the total was down another -2.7% to $3.566 billion.
Normally, accruals rise and fall in proportion to sales, and that was the case for some of these industries. New home sales were up +9.2% and their accruals were up +8.9%. Building material sales were down -0.6% and their accruals were down -1.1%. And then appliance/HVAC sales were down -8.6% while their accruals fell -18%. But the even bigger mismatch was in the power generation equipment category, where sales fell -10% but accruals rose +8.1%.
Figure 2
Homebuilding & Materials Warranties
Accruals Made by U.S.-based Manufacturers
(in US$ millions per quarter, 2016-2020)
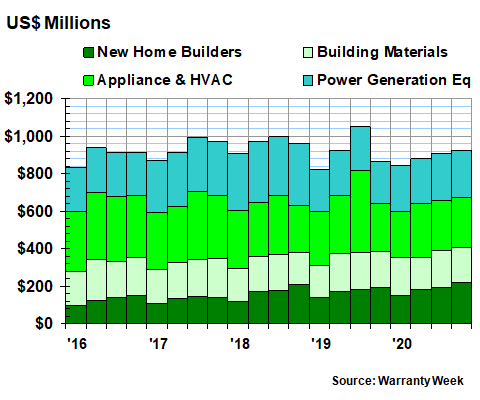
On a quarterly basis, both the new home builders and the power equipment makers set aside more accruals in every quarter of 2020 than they did in the corresponding quarters of 2019. The companies in the other two categories turned in a mixed picture of both ups and downs, although building material accruals fell by -16% in the lockdown-plagued second quarter.
That power generation category is a diverse mix of manufacturers, with the largest among them the General Electric Company, which we've moved over from the appliance category (they sold their GE Appliances division in 2016 to the Haier Group, which does not report its warranty expenses publicly). And even GE is somewhat diverse within just the power sector, with GE Energy making natural gas-powered and nuclear/steam-powered turbines for electrical power plants, and GE Renewable Energy making giant wind turbines and hydroelectric plants.
Other nuclear energy companies such as Babcock & Wilcox, and GSE Systems Inc. are also on the list, as are several generator manufacturers (such as Generac Holdings Inc. and Capstone Turbine Corp.), and many solar energy companies (led by SunPower Corp., SolarEdge Technologies Inc., First Solar Inc., and Enphase Energy Inc.). And there are a few smaller battery and wind energy companies as well (e.g. American Superconductor Corp. and Broadwind Energy Inc.).
We mention this because like HVAC companies, some of these power generation equipment manufacturers provide very long warranties, compared to the year or two given to many household, kitchen, and personal appliances. In addition, the solar manufacturers tend to overdo it a bit on the accruals, setting aside much larger amounts of money than they currently pay out in claims.
Warranty Expense Rates
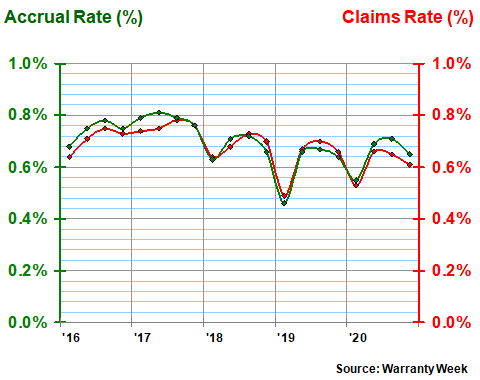
Meanwhile, the homebuilders have some strange habits of their own. In Figure 2, you will notice that within each group of four quarters, the first quarter of each year has the lowest accrual total for the homebuilders, while the fourth quarter is the highest of the year (except for 2017).
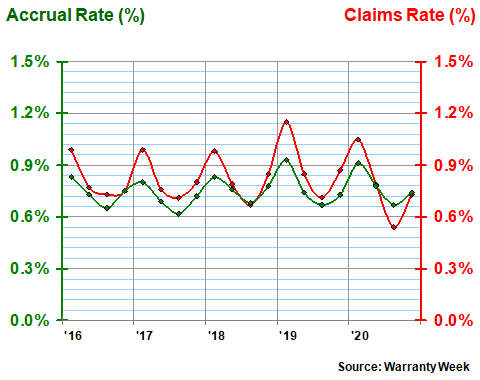
In Figure 3, you will notice that when we compare those accrual totals to home sales revenue totals, the first quarter reading is always the highest of the year while the third quarter is lowest. Of course, both can be easily explained by a look at the seasonal pattern of new home constructions and sales.
But there's something else going in in Figure 3 that deserves a mention. While accruals follow their predictable seasonal pattern, the industry's claims rate dove to a new low of 0.5% of revenue in the third quarter of 2020. This, we think, is another sign of the effects of the lockdowns, which made both customers and contractors reluctant to schedule warranty work inside homes.
Figure 3
New Home Warranties
Average Claims & Accrual Rates
(% of revenue, 2016-2020)
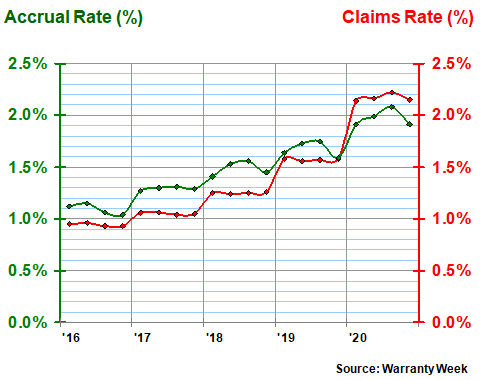
In Figure 4, we have combined the appliance and HVAC warranty expenses that we detailed separately in the April 22 newsletter. We've also taken out the older United Technologies data and moved GE to a different category as well.
What's left behind is a pair of warranty expense rates that have been generally close to 1.2% of revenue over the last five years. Accrual rates dropped below one percent in the first and third quarters of 2020, but the average was back up to nearly 1.2% by year's end. Claims rates were low in 2019 but were close to that long-term 1.2% average in 2020.
Figure 4
Appliance & HVAC Warranties
Average Claims & Accrual Rates
(% of revenue, 2016-2020)
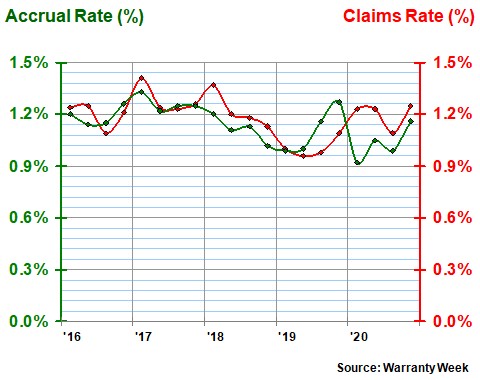
Most of the details about the individual appliance and HVAC companies was included in the April 22 newsletter, so we won't repeat it here. But in general, the warranty expense rates of the HVAC companies were found to be lower and more stable than those of the home appliance companies. For instance, in most quarters the average HVAC claims and accrual rates were below one percent while the appliance averages were usually above one percent.
Building Material Expense Rates
Well over a hundred companies are part of the building material group, producing everything from roofing to carpets, plumbing fixtures to windows. As such they are the suppliers to the builders of new homes, as well as to the renovators of existing homes.
In Figure 5 it appears that there is a bit of a seasonal pattern to their average warranty expense rates, with the claims and accrual rates dipping to their lowest point early in the year, then hitting a high point in the spring or summer. But not all 114 companies follow this pattern. For instance, Stanley Black & Decker Inc. saw its highest claims and accrual rates of 2020 in the first quarter, and its lowest in the fourth. Pentair plc reported its highest claims rate of 2020 in the third quarter and its highest accrual rate in the first quarter.
Figure 5
Building Material Warranties
Average Claims & Accrual Rates
(% of revenue, 2016-2020)
Sherwin Williams Co., following its acquisition of Valspar, saw its claims rate fall while its accrual rate rose last year. RPM International Inc. saw both its warranty expense rates rise last year, while Acuity Brands Inc. saw both fall. Cornerstone Building Brands Inc. kept both its warranty expense rates more or less the same.
As was mentioned, sales were down -0.6% while accruals were down -1.1% in this category last year. So the expense rates remained more or less the same -- 0.67% in 2019 and 0.66% in 2020. Claims dipped -19% and accruals dipped -16% in the second quarter of 2020, compared with 2019, while accruals in the second half of the year were little changed. Therefore, it's no surprise to see the seasonal patterns look more or less the same in 2019 and 2020.
Power Generating Equipment
In contrast to the first three industry categories, our fourth group, containing the power generating equipment manufacturers, has seen its expense rates rise steadily over the past five years. In fact, this upward trend began at the end of 2014, when both the average claims and accrual rates jumped by more than +0.25% in a single quarter.
Figure 6
Power Generating Equipment Warranties
Average Claims & Accrual Rates
(% of revenue, 2016-2020)
GE dominates this category in terms of both revenue and warranty expenses, reporting claims payments of $913 million in 2020 and accruals of $788 million. Its warranty expense rates were also up sharply last year, with claims rising from 1.7% to 2.4% of revenue and its accrual rate rising from 1.7% to 2.1%. Product revenue fell -12%.
SolarEdge saw its claims rate rise from 3.0% to 4.8%, and in response it raised its accrual rate from 6.6% to 7.0%. Enphase and SunPower kept both rates about the same from 2019 to 2020. First Solar saw its claims rate remain about the same, but slashed its accrual rate from 0.6% to 0.3%.
Both Generac and Capstone Turbine saw their warranty expense rates rise moderately last year. Babcock & Wilcox saw big jumps in both, with claims rising from 1.4% to 2.5% and accruals rising from 1.1% to 2.1% of revenue.
Warranty Reserves
Our final metric for the building trades is the balance in the warranty reserve funds of these 280 companies at the end of each quarter. At the end of 2020, their collective balance was $7.322 billion, down by $200 million from the record level seen at the end of 2019.
Figure 7
Homebuilding & Materials Warranties
Reserves Held by U.S.-based Manufacturers
(in US$ millions per quarter, 2016-2020)
Power generation equipment accounted for nearly $2.6 billion of that total, with GE accounting for more than $2.0 billion of that. However, that balance was down by $162 million or -5.9% from the end of 2019.
The appliance and HVAC companies had a combined balance over $2.0 billion, with Carrier Global Corp. at $514 million, Trane Technologies at $283 million, and Whirlpool Corp. at $273 million. Their combined total was also down from the end of 2019, by $180 million or -8.2%.
New home builders held reserves of just under $1.5 billion, with Lennar Corp. at $342 million; D.R. Horton Inc. at $324 million; Toll Brothers Inc. at $157 million; NVR Inc. at $120 million; and Taylor Morrison Home Corp. at $118 million. Their combined balance grew by $89 million, or +6.4%.
And then finally, the makers of building materials ended 2020 with reserves of $1.227 billion, up $52 million or +4.4% since the end of 2019. Cornerstone Building Brands accounted for $216 million of that total, followed by Stanley Black & Decker at $114 million, and Masco Corp. at $83 million.