Mid-Year New Home Warranty Report:
Some homebuilders hit the bullseye every quarter with their warranty accruals. Others oscillate wildly, allocating way too much one quarter and next to nothing the next. And while new home sales are soaring, warranty expenses are not, suggesting either exemplary levels of quality or more inefficiency. gyrations.
It may come as a shock to some finance and warranty professionals (though not to readers of this newsletter) that not only are there people tracking the key ratios between sales and warranty metrics, and turning the results into charts, but they're also passing judgment about the skills level of the people who make the key decisions about how much to set aside for warranty costs based on the shape of those charts.
For all the publicly-traded homebuilders, we have been collecting three essential warranty expense metrics from their annual reports and quarterly financial statements since 2003. We collect data on the amount of claims paid, the amount of warranty accruals made, and on the balance in their warranty reserve funds at the end of each quarter.
We also collect data on two sales metrics: the number of new homes sold, and the revenue raised from those new home sales (not including mortgage or finance revenue, and not including sales of land alone). And by comparing these sales metrics to the warranty metrics, we were able to calculate two additional metrics: the percentage of revenue set aside as warranty accruals (the accrual rate), and the average amount of accruals made per home sold.
Warranty Claims Totals
In Figure 1, it appears that warranty claims in the U.S.-based homebuilding are now on a downswing, after their recent peak at the end of 2018. Indeed, claims paid in the first half of 2021 are down 12% to $329 million, compared to the first half of 2020. Compared to the year-ago quarters, industry claims have now fallen for five straight quarters, with the first quarter of 2020 up only marginally from the first quarter of 2019.
Figure 1
Homebuilding Warranties
Claims Paid per Quarter by U.S.-based Builders
(in US$ millions, 2003-2020)
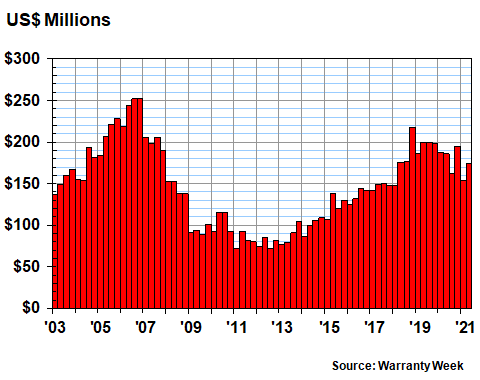
Twice now in recent years -- in the third quarter of 2020 and again in the first quarter of 2021 -- the quarterly claims total has fallen by 18% year-over-year. That is a dramatic downturn, especially in an industry filled with sales growth. Either product quality has risen dramatically, or something has been preventing homeowners from getting their warranty work done (hint: the pandemic and the lockdowns).
Warranty Accrual Totals
The homebuilders we follow accounted for about 32% of the new construction in 2020, based on a comparison of their count of 260,000 homes built and the industry total of 815,000 homes built reported by the U.S. government. But there's a definite seasonal pattern to the data. Every year, the first quarter is always the slowest, and the fourth quarter is always the busiest.
In the first quarter of 2021, new home closings for the builders we follow were up 24% to nearly 66,000 units, compared to the first quarter of 2020. New home closings in the second quarter were up 21% to 75,000 units, meaning back-to-back quarters of greater-than-20% growth rates. There hasn't been even a single quarter with a growth rate over 20% since 2013, so it's no exaggeration to say that sales are now soaring.
Warranty accruals have not kept up that pace. In the first half of 2021, accruals rose 11% to $377 million. Accruals were up 10% in the first quarter and 12% in the second quarter, so they're growing roughly half as fast as unit sales. And as we just noted, claims fell by 12% in the first half of 2021.
In the chart below, notice the seasonal pattern in which accruals rise like a staircase through each year, from the first to the second to the third and then the fourth quarters, before falling back again. In the past decade, the only times it didn't happen were in 2017 and 2013. And it looks like it's happening again this year.
Figure 2
Homebuilding Warranties
Accruals Made per Quarter by U.S.-based Builders
(in US$ millions, 2003-2020)
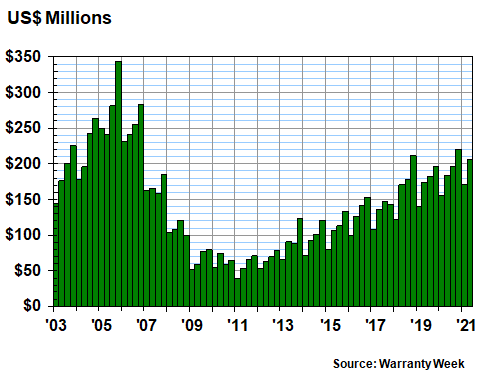
Notice also that while we're once again tallying quarters in which the homebuilders accrue upwards of $200 million, it's still far below the 2005-06 peak. Then again, let's be grateful it's also so far above the 2009-11 canyon.
Warranty Reserve Balances
In Figure 3, we are tracking the cumulative balance in the warranty reserve funds of the homebuilders at the end of each quarter. One could guess that with slowly rising accruals and slowly declining claims, the balance in these reserve funds would slowly climb. And indeed, for the past few years, this is what has been happening.
By June 30, 2021, the reserve balance had risen to $1.524 billion, yet another new record. We first surpassed the 2006 record in 2018, then again in 2019, and we haven't come close to it since.
Figure 3
Homebuilding Warranties
Reserves Held per Quarter by U.S.-based Builders
(in US$ millions, 2003-2021)

Compared to June 2020, the mid-year reserve balance this year is up 10% from a year ago. And that's the highest annual growth rate for reserves since late 2018 (though nothing compares to the huge spike in reserves seen at the end of 2016 and maintained throughout 2017).
Warranty Accrual Rates
In the homebuilding industry, as with passenger cars, the warranty-issuing companies do a good job of detailing their unit sales figures. This allows us to measure warranty accrual rates in two ways: as a percentage of revenue and per unit sold.
In Figure 4, we've done both. And while the accrual rate per dollar of revenue continues to oscillate in that seasonal pattern, the accrual rate per home sold seems to have settled down in the past two-and-a-half years.
Compared to the long-term averages, which are calculated over 74 quarters, the accrual rate per home sold is higher but more stable, while the accrual rate per dollar of revenue is lower and also a bit more stable.
Figure 4
Homebuilding Warranties
Average Warranty Accrual Rates
($ per home and % of revenue, 2003-2021)

In the last 10 quarters, the accrual rate per dollar of revenue has ranged from 0.67% to 0.93%, which averages out to 0.77%. The accrual rate per home sold, meanwhile, ranged from $2,552 to $2,747, averaging out to $2,646. The standard deviations, which are a measure of the volatility of the measurements, have been 0.09% and $65 over that time period.
Over the past 74 quarters, the accrual rate per dollar of revenue averages out to 0.85%, with a standard deviation of 0.13%. The long-term accrual rate per home sold averages out to $2,565, with a standard deviation of $260.
Accrual Rates for Specific Builders
In the following five charts, we are going to detail the accrual rates per home sold for 20 of the builders we track. Back in Figure 4, we saw that this average for the industry as a whole had a tendency to occasionally spike, especially from 2005 to 2009, and again in 2013 and 2018. Now we shall see why.
In each of these charts, there is a company that mostly flat-lines, and another that occasionally spikes. With this metric, unlike a heart monitor, flat lines are good, and spikes or sine waves are bad. Basically, what we are measuring is the ability of a company to accurately predict its warranty liabilities.
Let's say you're a builder, and over the long term you calculate that every time you sell a home, the average warranty cost is about $1,300. If that's the case, then every time you sell a home, you would put $1,300 aside, no matter how many or how few homes you sold. And if you did that, you'd get a chart that looks more or less like D.R. Horton Inc. in the chart below -- a relatively flat line, compared to most.
In contrast, let's say you have no clue about your warranty costs. Sometimes, you set aside $8,700 per home sold. Other times you set aside $2,700. If you did that, your accrual rate chart would look like a seismograph during an earthquake. And indeed, some of them in the charts below do look that way.
Alternatively, let's say you guess wrong one quarter, and you accrue twice as much as you needed to, so to make up for it, two quarters later you cut your accruals in half. In the long run, you keep close to the average, and in the short term you hope nobody puts it into a chart that all can see. Like we said, a flat line is a good line.
Figure 5
Homebuilding Warranties
Warranty Accruals Made per Unit Sold
(in US Dollars, 2003-2021)
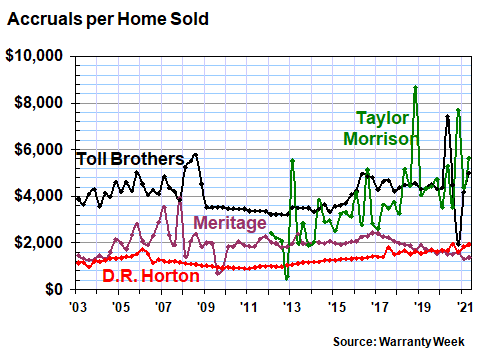
Over the long term, Toll Brothers Inc. is averaging an accrual of $4,083 per home sold, which is considerably higher than the industry average. But so are the selling prices of its luxury homes, so it all works out in the end. Similarly, Taylor Morrison Home Corp., at $3,713, is also somewhat above the industry average. However, Meritage Homes Corp., at $1,948, is one of the builders whose accrual rate per home sold is nearly always below the long-term industry average.
In Figure 6, the lines get a bit more chaotic, with KB Home and PulteGroup Inc. ending up above the average and M.D.C. Holdings Inc. and Century Communities Inc. ending up below average. None of these are flat lines like D.R. Horton or even Meritage, though at least MDC and Century seem to be stabilizing recently.
Figure 6
Homebuilding Warranties
Warranty Accruals Made per Unit Sold
(in US Dollars, 2003-2021)
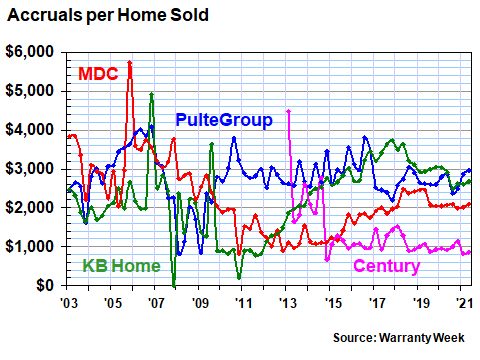
Over the long term, Pulte is a bit above average at $2,786 per home sold, while KB Home is a bit below average at $2,268. MDC is at $2,211, and Century is close to the bottom at $1,348 per home sold.
In Figure 7, we had to change the vertical scale to make room for some absolutely incredible readings. Back in 2015, the New Home Company Inc. accrued as much as $19,300 per home sold. And then at one point in 2016, it accrued nothing -- zero. Does that mean the actuaries told them every house was perfect? Or again, did they think nobody was paying attention?
Figure 7
Homebuilding Warranties
Warranty Accruals Made per Unit Sold
(in US Dollars, 2003-2021)
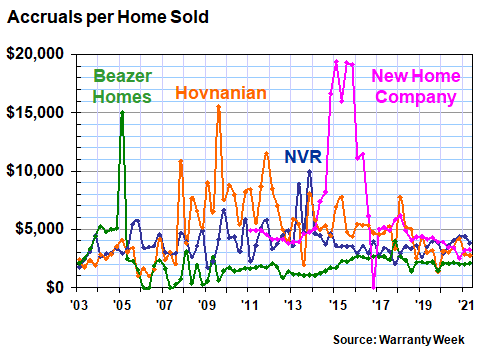
Beazer Homes USA Inc. and Hovnanian Enterprises Inc. had their own spikes years ago. And Beazer, at least has also had quarters in which every home was perfect, and no accruals were necessary. But actually, Hovnanian has the second-highest long-term accrual rate among all the builders, behind only New Home Company.
We do not think this correlates to higher selling prices. Rather, we suspect it's a sign of unforeseen expenses such as problems with leaks and Chinses drywall. Hovnanian's accrual rate as a percentage of sales has risen as high as 5.9% at times. And while New Home's average accrual is $6,415 per unit sold, its standard deviation for that metric is also extremely high at $4,775, suggesting extreme volatility.
In Figure 8, we're looking at the track records of two companies that no longer report their warranty expenses, and two companies that do. William Lyon Homes was acquired by Taylor Morrison in 2019. Meanwhile, Shea Homes LP was never really a publicly-traded company in terms of the stock market, but for a few years it did have some bonds out in the public market that required it to file public financial statements.
Figure 8
Homebuilding Warranties
Warranty Accruals Made per Unit Sold
(in US Dollars, 2003-2021)
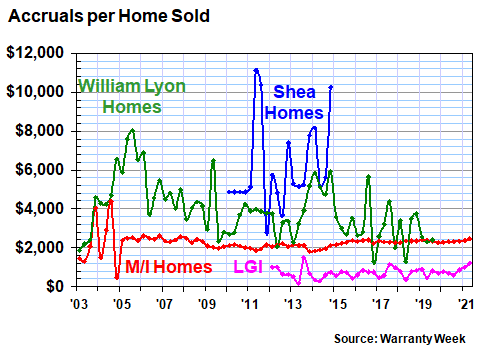
The two that still report are M/I Homes Inc. and LGI Homes Inc. And while M/I Homes is perhaps the most consistent of all the builders with a per-unit accrual rate that's always just a bit below the industry average, LGI holds the distinction of having the lowest accrual rate per unit among all the builders we track.
Finally, in Figure 9 we have what looks like four companies but is really just the family tree of one company. Standard Pacific Homes and the Ryland Group Inc. merged in 2015 and changed their name to CalAtlantic Group Inc. And then in early 2018, Lennar Corp. acquired CalAtlantic.
Figure 9
Homebuilding Warranties
Warranty Accruals Made per Unit Sold
(in US Dollars, 2003-2021)
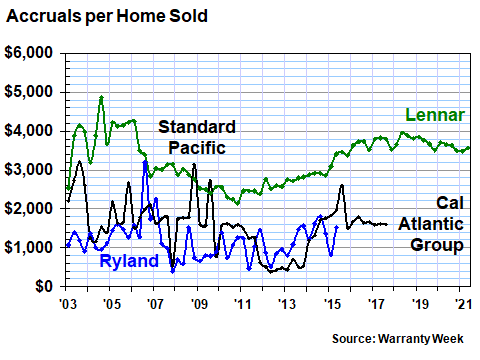
With nearly 53,000 homes sold last year, Lennar is the second-largest homebuilder on our list, behind only D.R. Horton at 65,400 units sold in fiscal 2020. And at $3,262, Lennar is also accruing more than the industry average per unit sold, though not significantly more.
However, the company's accrual rate as a percentage of sales is almost always within a tenth of a percent of 1.0%, which suggests that its warranty management routine is much more stable over the long term than it appears in this chart. No, it's not as flat as either M/I Homes or D.R. Horton, but it also doesn't look like an earthquake struck. Also, as unstable as its acquisitions were before they were acquired, they apparently haven't imported their chaos to Lennar's warranty metrics.