

March 26, 2008 |
|
ISSN 1550-9214 |
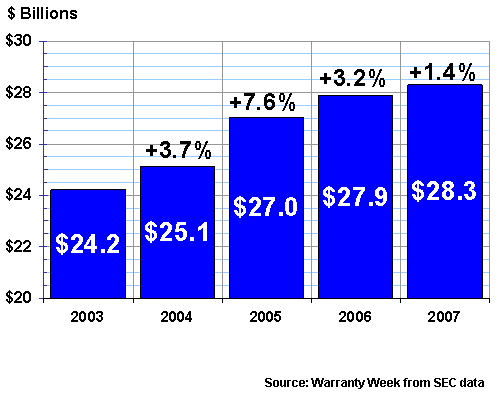
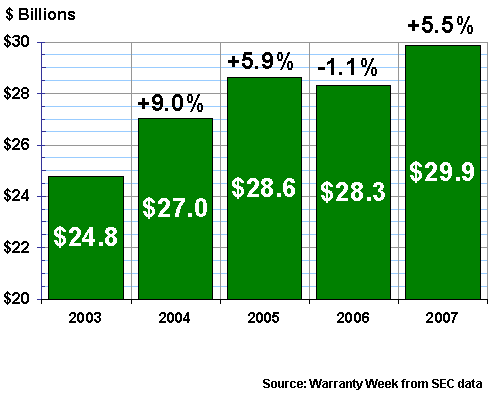
Top 100 Warranty Providers:Though total warranty claims were up only slightly in 2007, some manufacturers saw massive changes up or down. While we can't compare companies directly to each other, we can compare each company to itself. And we can measure those rates of change, detecting both improving and deteriorating warranty circumstances.American manufacturers seem to be getting their warranty expenses under control, as evidenced by just a very slight increase in claims paid in 2007. During the calendar year, some 700 U.S.-based manufacturers spent $28.3 billion on warranty claims worldwide, an increase of only 1.4% from the $27.9 billion counted in 2006. As a percentage of product revenue, claims remain very close to the 1.7% level that they've been at for most of the past three years, which in turn is a little below the 1.8% level seen in 2003 and 2004. Warranty accruals, meanwhile, jumped by 5.5% in 2007 to $29.9 billion. In other words, American manufacturers are putting more aside, but are paying out only a little bit more than they did a year ago. They're paying out considerably more than they did in 2003 or 2004, but as a percentage of product revenue it's somewhat less. That's because sales have grown faster than warranty claims, which causes the percentages to fall. Because of accounting changes spurred by the Enron and WorldCom scandals, since 2003 all American manufacturers have been required to reveal the net amounts they spend on warranty claims, as well as changes in their warranty reserve fund balances. Warranty Week has been collecting this data on a quarterly basis, comparing it in each case to product revenue to calculate both a claims rate and an accrual rate. The figures above are a weighted average of all claims and all accruals divided by all product revenue. So of course, big warranty providers such as General Motors, Dell, Ford and Hewlett-Packard pull the average upwards somewhat. Over the course of the next several weeks, we'll delve deeper into these figures, computing baseline averages for specific industries as well as different company sizes. Growth You Don't WantRight now, we'll give just the totals for claims paid over the past five years, along with the annual increases. As is apparent thanks to the exaggerated vertical scale used in Figure 1a, it seems as if claims are starting to level off just above the $28 billion mark. Whether this is a product of a slowing economy or a result of more efficient warranty management and quality control remains to be seen. We hope it's the latter, but at least it's very good news to report that warranty costs are not soaring. Figure 1a | ||||||||||||||||||||||||||||||||||||||||||||||||||||||||||||||||||||||||||||||||||||||||||||||||||||||||||||||||||||||||||||||||||||||||||||||||||||||||||||||||||||||||||||||||||||||||||||||||||||||||||||||||||||||||||||||||||||||||||||||||||||||||||||||||||||||||||||||||||||||||||||||||||||||||||||||||||||||||||||||||||||||||||||||||||
| Claims | Claims | Latest | vs. | |
| Paid | Paid | Claims | Year | |
| Company | in 2007 | in 2006 | Rate | Ago |
| Visteon Corp. | $29 | $85 | 0.3% | -65% |
| Thermo Fisher Scientific | $38 | $37 | 0.4% | -59% |
| Johnson Controls Inc. | $123 | $129 | 0.3% | -42% |
| Medtronic Inc. | $27 | $40 | 0.2% | -42% |
| Harman International | $56 | $48 | 0.8% | -38% |
| Goodrich Corp. | $45 | $60 | 0.7% | -31% |
| Nortel Networks Corp. | $182 | $267 | 1.9% | -28% |
| General Electric Co. | $573 | $665 | 0.8% | -26% |
| Dell Inc. | $1,189 | $1,217 | 2.2% | -23% |
| Honeywell International | $203 | $230 | 0.7% | -20% |
The prize for the top decline in claims rate from 2006 to 2007 goes to Visteon, which a year ago saw its claims rate spiking from the 0.2% level that it ended 2005 with. We'll leave the discussion of this to a future column on auto parts suppliers. For now, suffice it to say that the trend towards automakers pushing more of their warranty expenses back onto suppliers, for which Visteon was something of a shining example in 2005-2006, didn't seem to last. For Visteon at least, it's back to business as usual. However, it's a different story for ArvinMeritor, BorgWarner, and Delphi.
If a company's claims rate went from 2% to 3% in a year, we'd calculate that to be a 50% increase. And sadly, that wouldn't even make the top ten this time. ArvinMeritor saw its claims rate more than double, while BorgWarner was up by 79%. Delphi's claims rate was up only 8.3%, though its accrual rate was up significantly (see Figure 5).
However, look closer at the data in Figure 3 below. Two of the companies paid out less in dollars yet they saw their claims rate rise. How so? Because their sales fell even faster -- a common problem particularly within the homebuilding industry. Lennar, for instance, saw home sales fall from $14.9 billion in 2006 to $9.5 billion in 2007. That more than wiped out the $6 million decline in claims paid. Two other homebuilders also saw their claims rate rise by more than 50%, primarily because of falling sales.
The Tyco Breakup
Tyco International, however, is a bit of a different story. In June 2007, the company actually shrank in size, thanks to the spin-offs of Covidien and Tyco Electronics into separate public companies. Covidien isn't reporting any warranty expenses for its healthcare lines of business, but Tyco Electronics is reporting roughly $5 million a year in claims on $13.5 billion in sales.
The problem is, Tyco International had a 0.24% claims rate a year ago, when it was all one company. And though companies might restate their revenues to account for discontinued operations, they can't "unspend" their year-ago claims. Whatever the entities are called now, in calendar 2006 Tyco International paid out $83 million in warranty claims. Though that amount declined to $69 million in 2007, the amount of revenue it's compared against fell even faster because of the spin-offs. Therefore, at least on paper, the claims rate went up by 168%.
Figure 3
Top 100 U.S.-based Warranty Providers:
Top Ten Claims Rate Increases,
2007 vs. 2006
(in $ millions and percent)
| Claims | Claims | Latest | vs. | |
| Paid | Paid | Claims | Year | |
| Company | in 2007 | in 2006 | Rate | Ago |
| Microsoft Corp. | $480 | $42 | 6.2% | +1666% |
| Tyco International | $69 | $83 | 0.6% | +168% |
| ArvinMeritor Inc. | $61 | $54 | 1.0% | +105% |
| BorgWarner Inc. | $55 | $26 | 1.0% | +105% |
| Palm Inc. | $103 | $73 | 8.6% | +78% |
| Dover Corp. | $33 | $25 | 0.5% | +72% |
| Briggs & Stratton | $49 | $33 | 3.8% | +66% |
| Hovnanian Enterprises | $47 | $37 | 1.0% | +66% |
| D.R. Horton Inc. | $52 | $52 | 0.7% | +55% |
| Lennar Corp. | $162 | $168 | 1.7% | +51% |
And then there's Microsoft. Clearly, there's no acquisition or divestiture story to ameliorate its 2007 warranty experience. All there is is pain. There's the pain of a 1666% increase in its claims rate and there's the pain of a 1539% increase in warranty accruals. Both rates are now above 6% of the Xbox division's sales, up dramatically from their sub-1% levels of early 2006. Equally dramatically, Microsoft has now surpassed the likes of Boeing, Apple, and Paccar to become America's 13th largest warranty provider.
By the way, there is a full list of the top 50 warranty providers on the home page of Warranty Week. What we've done here is lengthened the list to 100 companies and calculated the biggest increases and declines. And by every measure, Microsoft comes out of 2007 as the biggest gainer. But of course, this is not a prize anyone would seek.
Small Changes for Big Companies
Before anyone asks what happened to the big four -- GM, Ford, HP and Dell -- only the latter managed to make any of the top ten lists, and it's towards the bottom of the lists in both Figures 2 and 4. For Dell, sales grew and both claims and accruals fell, in terms of both dollars and percentages. For Ford and HP, claims and accruals fell by single-digit percentages, and for GM, claims fell while accruals rose. But none made the top ten.
In Figure 4, we're calculating reductions in the accrual rates. These are less vulnerable to sales swings, and more accurately reflect changes in expectations. If, for instance, a computer maker expects future warranty claims on a $1,000 laptop to equal $40, they would put aside 4% of sales revenue as their warranty accrual. If they sell a thousand computers, they would set aside $40,000. If they sold only 500 laptops, they'd put aside only $20,000. Either way, the accrual rate would remain steady at 4%.
In Figures 4 and 5, however, what we're measuring is a change in the rate at which these companies set aside funds. Whether it's caused by a change in quality or product mix or repair cost we cannot say. As external observers, all we can do is report the math. It's up to shareholders to ask management why they're suddenly setting aside half as much or twice as much as they used to.
Figure 4
Top 100 U.S.-based Warranty Providers:
Top Ten Accrual Rate Reductions,
2007 vs. 2006
(in $ millions and percent)
| Accruals | Accruals | Latest | vs. | |
| Made | Made | Accrual | Year | |
| Company | in 2007 | in 2006 | Rate | Ago |
| Thermo Fisher Scientific | $41 | $41 | 0.4% | -62% |
| Eaton Corp. | $57 | $91 | 0.4% | -41% |
| Pulte Homes Inc. | $72 | $165 | 0.8% | -33% |
| TRW Automotive Holdings | $47 | $60 | 0.3% | -30% |
| Fleetwood Enterprises | $67 | $80 | 2.6% | -28% |
| Rockwell Automation | $44 | $57 | 0.9% | -27% |
| United Technologies | $450 | $533 | 1.1% | -26% |
| General Electric Co. | $637 | $735 | 0.9% | -26% |
| KLA-Tencor Corp. | $58 | $58 | 2.1% | -23% |
| Dell Inc. | $1,173 | $1,224 | 2.4% | -22% |
For Tyco, it's highly likely the change in accrual rates has a direct link to the spin-offs. For others, especially those that appear on both a claims and an accrual top ten, management is probably reacting to changes in quality.
But that still leaves a few mixed messages. Of the 49 companies that saw their claims rate fall from 2006 to 2007, 11 increased their accrual rate. Of the 44 companies that saw their claims rate rise, 16 cut their accrual rates at the same time.
Claims are what happens to you after a product is sold. Accruals are what you believe will happen in the future. So when a company increases its accrual rate despite a fall in claims, it is signaling that it expects claims to rise in the future. In the opposite case, a company is predicting that claims will fall despite the current increase. However, perhaps it's also possible that they think nobody's looking, so let's increase profits by shorting the warranty reserve fund during the slowdown?
Figure 5
Top 100 U.S.-based Warranty Providers:
Top Ten Accrual Rate Increases,
2007 vs. 2006
(in $ millions and percent)
| Accruals | Accruals | Latest | vs. | |
| Made | Made | Accrual | Year | |
| Company | in 2007 | in 2006 | Rate | Ago |
| Microsoft Corp. | $1,222 | $45 | 6.1% | +1539% |
| Hovnanian Enterprises | $74 | $43 | 1.6% | +121% |
| Tyco International | $36 | $48 | 0.3% | +79% |
| Briggs & Stratton | $51 | $33 | 3.8% | +72% |
| Delphi Corp. | $291 | $207 | 1.3% | +67% |
| Joy Global Inc. | $37 | $22 | 1.4% | +59% |
| Mohawk Industries | $67 | $49 | 1.6% | +56% |
| Dover Corp. | $40 | $33 | 0.6% | +43% |
| BorgWarner Inc. | $61 | $37 | 1.1% | +42% |
| Lexmark International | $285 | $232 | 19% | +37% |
And then there are the six companies that we suspect should be in the top 100, but which have not provided enough data for us to be certain. Beazer Homes and Navistar International are late with their financial statements. Emerson Electronics chooses to provide only its reserve fund's opening and closing balances for the year. Meanwhile, Exide Technologies, Goodyear, and Xerox have decided they couldn't be bothered with compliance, so they have chosen to discontinue reporting their warranty expenses altogether. In each case, we have constructed place-saving estimates for 2007, but we didn't think it was appropriate to calculate the year-to-year changes.
Warranty Reserve Fund Changes
In Figures 6 and 7, we looked at the year-ending balances in each of the top 100 warranty providers and calculated the top gainers and decliners in size. Once again, acquisitions and divestitures account for several of the changes. There is not only the aforementioned Tyco story, but also major divestitures by Kodak and Ingersoll-Rand that have impacted warranty balances. When a division is sold, its warranty funds usually go with it.
That doesn't explain the warranty accounting of companies such as Centex and Sherwin Williams, however. Both saw their claims rates rise yet both cut their accrual rates. And of course that led to declines in their warranty reserve balances, since funds were leaving faster than they were arriving.
Figure 6
Top 100 U.S.-based Warranty Providers:
Top Ten Warranty Reserve Fund Reductions,
2007 vs. 2006
(in $ millions and percent)
| Warranty | vs. | |
| Reserve | Year | |
| Company | 12/31/07 | Ago |
| NCR Corp. | $13 | -38% |
| Tyco International Ltd. | $154 | -35% |
| Quantum Corp. | $22 | -34% |
| IBM Corp. | $412 | -29% |
| Eastman Kodak Co. | $44 | -27% |
| Centex Corp. | $35 | -25% |
| Ingersoll-Rand Co. Ltd. | $147 | -25% |
| Pulte Homes Inc. | $91 | -22% |
| ArvinMeritor Inc. | $97 | -22% |
| Sherwin Williams Co. | $20 | -22% |
It's the opposite story at Cummins, Polaris, Medtronic, and four others. Claims fell, accruals rose, and the warranty reserve grew in size as funds arrived faster than they could be spent. But for none of these seven did the reserve grow by enough to make the list in Figure 7. The smallest of the top ten increases was Boeing, which saw its warranty reserve grow from $761 million at the end of 2006 to $962 million at the end of 2007 (a 26% increase). The largest was of course Microsoft, which thanks to the Xbox 360 debacle saw its warranty reserve surge to $861 million at the end of 2007 from what we estimate was an $11.5 million total at the end of 2006 (back then, the company didn't even bother reporting its warranty expenses).
Figure 7
Top 100 U.S.-based Warranty Providers:
Top Ten Warranty Reserve Fund Increases,
2007 vs. 2006
(in $ millions and percent)
| Warranty | vs. | |
| Reserve | Year | |
| Company | 12/31/07 | Ago |
| Microsoft Corp. | $861 | +7387% |
| Garmin Ltd. | $72 | +90% |
| Mohawk Industries Inc. | $46 | +75% |
| Delphi Corp. | $559 | +44% |
| General Electric Co. | $1,541 | +35% |
| Manitowoc Co. Inc. | $92 | +33% |
| Netgear Inc. | $28 | +29% |
| Hovnanian Enterprises | $121 | +29% |
| Joy Global Inc. | $49 | +27% |
| Boeing Co. | $962 | +26% |
For anyone keeping score, only 42 of the top 100 warranty providers made any of these six lists. GE, Hovnanian Enterprises, Microsoft, and Tyco International were the only companies to max out by making three of the six lists. Ten more made it onto two lists and the rest appeared only once.
At no point are we suggesting that one company's numbers are better than another's. Instead, we're comparing each company against itself, and then we're comparing the changes over time. And while a doubling of a given rate from 0.3% to 0.6% isn't as severe a fiscal drain as a doubling from say 3% to 6%, it's nevertheless a doubling.
Five-Year Trends
In a future column, we'll take a look at trends over the past five years, to see whether specific companies have formed a baseline over the period that defines what is "normal" for them. For one company, "normal" could be 0.3% while for another, 3.0% might be quite "normal" for its given product line and average warranty duration.
Over the past five years, each of these manufacturers has provided external observers with a baseline. Now, with five years of data in hand, we can spot departures from that baseline which can be used by an external observer as evidence of a spike or a trough that in turn might signal a change in quality or repair costs. Or it could be the result of a merger or a divestiture.
In other words, it's not the amounts, and it's not even the rates that matter. What reveals the most are the changes over time, when companies are compared against their own track records.
In the old days, before 2003, most of this data was kept secret by manufacturers, because it could be misconstrued by competitors and customers alike (not to mention newsletter editors). So perhaps we should all thank Enron and WorldCom for setting the bar so low that a change resulted in the regulations governing disclosures of guarantees. Ironically, neither provided any warranties, because both were service companies.
Complete Reports Available For Sale
Graphs of the top 100 warranty providers, all the individual members of these industry groupings, and both annual and five-year collections of warranty data for all U.S.-based manufacturers that report their warranty expenses are available for sale on the Warranty Week Web site at the address http://www.warrantyweek.com/fasb/. Individual company slides are priced at $25 while the entire collection is priced at $1,995. Credit cards are accepted, and purchases can be made in dollars, euros, or yen.
This Is Part One
Go to Part Two
Go to Part Three
Go to Part Four
Go to Part Five
Go to Part Six

|
This Week’s Warranty Week Headlines | ||
|
Ford Motor Co. sells Jaguar & Land Rover to Tata Motors for a net $1.7 billion in cash. Press Release, March 26, 2008 | ||
|
Verizon Wireless sues telemarketers pitching extended warranties to its wireless customers. PC Magazine, March 26, 2008 | ||
|
Real estate agent suspects American Home Shield routinely denies home warranty claims. Consumer Affairs, March 26, 2008 | ||
|
Citroën Dispatch can run on up to 30% biodiesel without any effect on its warranty. Fermanagh Herald, March 26, 2008 | ||
|
Cimtek lists high warranty costs as a good reason to outsource product testing. Press Release, March 26, 2008 | ||
More Warranty Headlines below | ||

|
Warranty Headlines (cont’d) | ||
|
Railpower Technologies blames net loss on locomotive recall and warranty expense. Press Release, March 25, 2008 (PDF file) | ||
|
MaintenanceNet Inc. opens registration for three-part web seminar series on service contracts. Press Release, March 25, 2008 | ||
|
Two auto dealership employees arrested for allegedly falsifying warranty repair paperwork. Vero Beach Press-Journal, March 25, 2008 | ||
|
Skate park in Texas needs warranty work to reopen but its builder went bankrupt. Seguin Gazette-Enterprise, March 25, 2008 | ||
|
Consumer electronic buyback schemes TechForward & ecoNEW turn gadget trash to cash. Reuters, March 24, 2008 | ||
More Warranty Headlines below | ||

|
Warranty Headlines (cont’d) | ||
|
Reader disputes denied laptop extended warranty claim, writes to Assurant Solutions president. InfoWorld, March 24, 2008 | ||
|
Costly automated flagpole on school's roof stops working after its warranty expires. Hampton Roads Virginian-Pilot, March 24, 2008 | ||
|
Home Service USA Repair Management Corp. sells water pipe service contracts in Louisville. Louisville Courier-Journal, March 22, 2008 | ||
|
Henry Engineering detects bad capacitors and lengthens Matchbox HD warranty in response. Radio World, March 21, 2008 | ||
|
ASA rep tells Florida he prefers a federal emission program over a state-by-state approach. Tire Review, March 20, 2008 | ||
More Warranty Headlines below | ||

|
Warranty Headlines (cont’d) | ||
|
Best Buy to offer more than $10 million in gift cards to HD-DVD purchasers. Press Release, March 19, 2008 | ||
|
Retired chief of Florida's Bureau of Standards continues quest for warranty law change. Tallahassee Democrat, March 19, 2008 | ||
|
MaintenanceNet Inc. offers best-practice strategies for leveraging data analytics. Press Release, March 19, 2008 | ||
|
Sangoma Technologies Corp. announces lifetime warranty on telephony cards. Press Release, March 18, 2008 | ||
|
Consumer Reports finds 65% of vehicle service contract buyers don't save money on repairs. Press Release, March 17, 2008 | ||
More Warranty Headlines below | ||
|
|

Warranty Headlines (cont’d) | ||
|
Service Contract Industry Council responds to Consumer Reports vehicle service contract survey. Press Release, March 17, 2008 | ||
|
SAS acquires Teragram to strengthen text mining and natural language processing capabilities. Press Release, March 17, 2008 | ||
|
Wal-Mart Canada to launch first-ever retail product extended warranty program for electronics. Press Release, March 17, 2008 | ||
|
Blue Raven Technology launches suite of customized reverse logistics solutions. Press Release, March 17, 2008 | ||
|
ISS Facility Services offers termite timber replacement warranty in Brunei. Borneo Bulletin, March 15, 2008 | ||
More Warranty Headlines below | ||

|
Related Articles From Warranty Week |