Three weeks ago we took a look at U.S. Auto Warranty Expenses, two weeks ago we analyzed U.S. Truck & Heavy Equipment Warranties, and last week was U.S. Auto Parts & Powertrain Warranties. This week, we're tying together all three into this snapshot of 20 years of warranty data for the United States automotive industry.
We gathered warranty data from 193 U.S.-based automotive manufacturers over the course of 20 years, from the first quarter of 2003 to the fourth quarter of 2022. Of those 193, 104 were in business and publicly reporting their warranty data in 2022.
Of the 193 companies, 34 are or were engaged in the manufacture of cars and other small vehicles such as motorcycles, golf carts, and fishing boats. Another 34 make trucks, buses, recreational vehicles, and all sorts of heavy equipment used in activities such as agriculture, construction, and mining. And then the other 125 make parts and components used by these automotive OEMs, of which roughly 25 specialize in the manufacturing of powertrain components such as engines and transmissions.
From each company's quarterly and annual reports, we collected three warranty metrics: the amount of claims paid, the amount of accruals made, and the amount of warranty reserves held. We also collected data on product sales, which we used to calculate claims as a percentage of sales (the claims rate) and accruals as a percentage of sales (the accrual rate).
The automotive industry as a whole accounted for about 55% of all warranty claims made in the United States during 2022. Traditionally, cars and other small vehicles account for the highest proportion of these warranty expenses, while their suppliers typically have the lowest. This is due to the way their warranties are structured, with the tier 1 suppliers typically not interacting directly with the end-user consumer who would make a warranty claim. Truck manufacturers and their powertrain suppliers tend to have closer expense rates.
The pandemic did disturb these trends, but compared to the Great Recession, the recent "economic downturn" was just a ripple for three of the four groups. We will see that the car and small vehicle manufacturers bore the brunt of the economic troubles of 2020, while the large vehicle and powertrain manufacturers fared better than they did in 2008.
Warranty Claims Totals
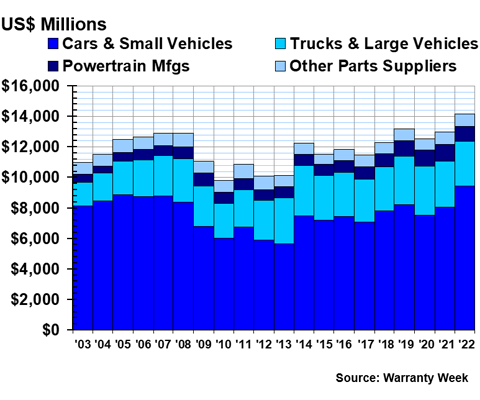
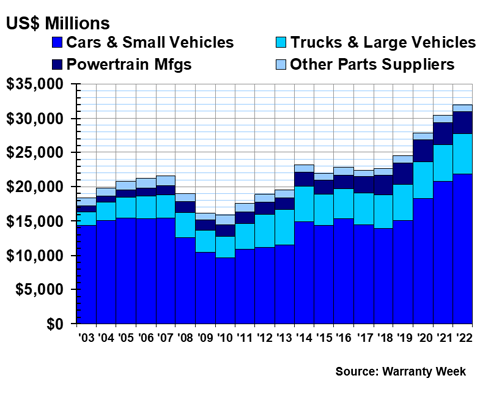
In Figure 1, we are detailing the annual totals for claims paid by the U.S.-based automotive industry over the past 20 years. While we collect these data quarterly, we are visualizing them annually to highlight overarching trends.
Figure 1
U.S.-based Automotive OEM & Supplier Warranties
Claims Paid per Year
(in US$ millions, 2003-2022)
In 2022, the small vehicle manufacturers paid $9.42 billion in claims, up $1.4 billion, or 17%, from 2021 levels. The large vehicle makers paid $2.95 billion in claims in 2022, down just $54 million, or -1.8%, from the year prior.
The powertrain manufacturers paid $974 million in claims in 2022, down $111 million, or -10%. And the other auto parts suppliers paid out $798 million in claims, down $14 million, or -1.7%.
In general terms, there appears to be three phases in the data below. From 2003 to 2008, warranty claims totals generally rose, peaking at the end of 2007. And then from 2009 to 2013, warranty claims remained low, as companies and customers recovered from the Great Recession. And then in 2014, beginning with General Motors Company's ignition switch recalls, claims bounced back to their former heights, until the lockdowns began last year.
We originally expected to see a sharp dip in warranty expenses in 2020 in Figure 1. However, on this annual chart, the existence of the pandemic is barely visibile. When analyzing the quarterly data, we do see a temporary downturn in the second quarter of 2020, but by the fourth quarter of the year, claims totals were back up to usual levels. Especially in the car and small vehicle industry, warranty work was generally just time-shifted to a few months later. This also holds true for the powertrain and other auto parts manufacturers, while the truck and large vehicle manufacturers saw an ever briefer decline. There was a pause, yes, but a very brief one, compared to the years of stagnation that came after the 2008 crash, a period so clearly demarcated in Figure 1.
These trends make sense when we consider them anecdotally. Let's go back in time three years ago to March 2020. A consumer who drives to work every day is suddenly getting a lot less use out of her vehicle. Perhaps she can't rationalize her warranty repair as "essential" and she has decided to stay at home for a few months until she feels safer and can get her hands on some coveted masks. But a trucker who transports toilet paper across the country actually has more demand than ever before, and he needs to ensure that his vehicle remains in good shape. He's not going to put off getting a repair done until the pandemic "ends." If his transmission needs fixing, he'll put in a warranty claim with the powertrain manufacturer right away; no time-shifting.
Warranty Accrual Totals
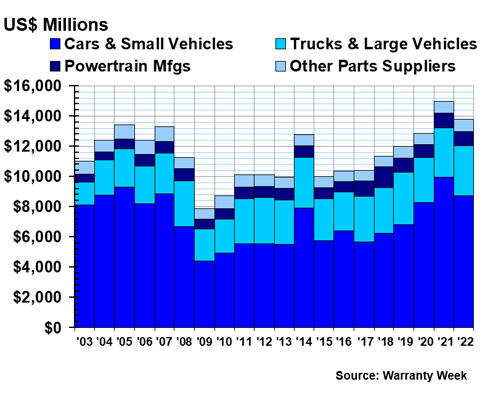
Figure 2 shows the annual warranty accrual totals of these four groups of automotive manufacturers.
Figure 2
U.S.-based Automotive OEM & Supplier Warranties
Accruals Made per Year
(in US$ millions, 2003-2022)
In 2022, the car and small vehicle manufacturers cut their accruals by -12%, or $1.23 billion, to $8.74 billion. This decline comes after GM made several big lump sum accruals in 2020 and 2021, which we detailed in our March 23, 2023 newsletter.
Accruals for the truck and heavy equipment manufacturers were up by just 1% to $3.30 billion in 2022. The powertrain suppliers cut accruals by -3.1% to $904 million. And the suppliers of other auto parts increased their warranty accruals by 3.7% to $827 million.
We see in Figure 2 that total warranty accruals actually increased in 2020, despite the pandemic. This increase is mainly due to GM's recent troubles, first with airbags in certain vehicles, and then with batteries in some of their electric vehicles. Again, we can compare this to the downturn in 2009, from which we see the industry took several year to recover. The taller bar from 2014 was also due to GM recalls.
Despite what we see in Figure 2, 2020 was actually an especially dramatic year for warranty accrual totals among the U.S.-based automotive manufacturers. In the second quarter of 2020, right after the pandemic was declared, the industry saw its lowest level of accruals since the depths of the Great Recession in 2009. But in the fourth quarter, accruals actually reached their highest level ever. Total accruals for that quarter were $4.93 billion, exceeding the closest quarterly record by more than $1 billion. This was the confluence of the first of GM's big accruals, and all of the time-shifted accruals from the rest of the industry. Some other major players such as Ford Motor Co. and Cummins Inc. continue to battle against high warranty expense levels as well.
Warranty Expense Rates
The claims and accrual data in Figures 1 and 2 can also be looked at in a different way. Using product sales data, we can calculate the percentage of revenue being paid out in claims, and being set aside in accruals. But because this is a moving average of both sales and warranty expenses, it does some unusual things in exceptional times.
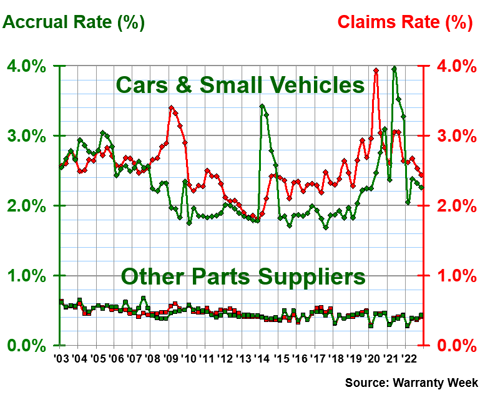
During recessions, sales usually fall faster than claims, so the claims rate usually spikes, as it did during 2009 and again in 2020, if you look at the red lines in Figures 3 and 4. And then, during spikes in recall activity, as happened with the GM ignition switches in 2014 (seen in Figure 3) or Cummins' issues with diesel engine emissions in 2018 (seen in Figure 4), the green line that follows the accrual rate can spike.
Figure 3 shows the average claims and accrual rates for two of the four groups, the small vehicle manufacturers and the other auto parts suppliers.
Figure 3
Small Vehicle Makers & Other Parts Suppliers
Average Warranty Claims & Accrual Rates
(as a % of sales, 2003-2022)
At the start of 2009, as sales dried up, small vehicle makers saw their claims rate spike to 3.4%. And then in the second quarter of 2020, as the lockdowns took hold, their claims rate rose to just under 4%. In early 2014, carmakers saw their accrual rate rise just above 3.4%. And then in the second quarter of 2021, it rose to 3.95%.
Long term, the average claims rate of the small vehicle manufacturers is 2.17%, with a standard deviation of 0.62%. Their average accrual rate is 2.07%, with a standard deviation of 0.68%. Both of these metrics have been especially volatile in recent years, and these standard deviations have both increased rather significantly just since the start of the pandemic as a result of the oscillation we see in Figure 3.
Meanwhile, the other parts manufacturers have kept close to their 0.46% average claims and accrual rates over the past 20 years, with a standard deviation of just 0.07%. Their expense rates actually took dives at the start of 2016, 2018, 2020, 2021, and 2022. They seem to be merely time-shifting expenses from earlier and later quarters, but this is an intriguing pattern that has emerged in recent years that suggests a little less predictability from these companies in the future. Long-term, though, the rates have been fairly stable, especially compared to the three other industry groups in this report.
In the automotive industry, the makers of small vehicles (up to perhaps the size of an SUV or a pickup truck) tend to be responsible for the warranty of the entire vehicle -- the so-called bumper-to-bumper manufacturer's warranty. But in the truck and bus industries, manufacturers tend to issue separate warranties to the end user customer for the chassis, engine, transmission, and other major components.
Therefore, in Figure 3, the OEMs at the top are the customers of the suppliers at the bottom. And since all companies are reporting their net expenses, one company's payment is another company's reimbursement. But in Figure 4, the truck and bus OEMs at the top issue their own warranties to their end user customers, while the powertrain manufacturers at the bottom then issue their own separate warranties to their end user customers.
We mention because it explains why the line pairs in Figure 4 are closer together than those in Figure 3. Plain and simple, bumper-to-bumper warranties are more expensive than separately-warranted components, because there's more friction between OEMs and suppliers than there is between dealers and warranty providers. Or to put it another way, it's easier for the repair organization to collect from a manufacturer than it is for one manufacturer to collect from another manufacturer.
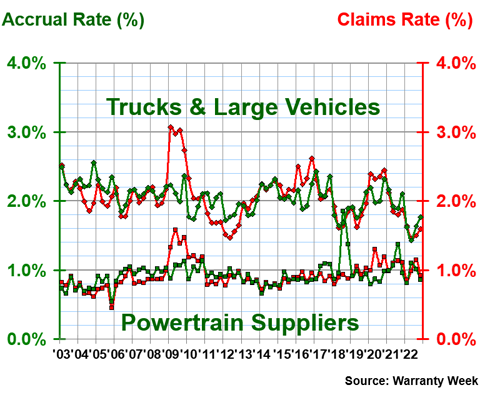
Figure 4 shows the average claims and accrual rates for the other two groups of auto manufacturers, trucks and heavy equipment and powertrain. In Figure 3, the average gap between the line pairs is 1.7% for the claims rates and 1.6% for the accrual rates. In Figure 4, the average gap between the line pairs is 1.1% for both the claims and accrual rates.
Figure 4
Large Vehicle Makers & Powertrain Suppliers
Average Warranty Claims & Accrual Rates
(as a % of sales, 2003-2022)
Note that in the third quarter of 2018, the two accrual rate lines actually met, as powertrain manufacturer Cummins dealt with its California engine emissions warranty problems, and as OEMs enjoyed a brief dip in their expense rates.
Over the 20 years, the average claims rate for the large vehicle manufacturers was 2.05%, with a standard deviation of 0.33%. The average accrual rate was 2.04%, with a standard deviation of 0.22%. It's interesting that these averages are so close together, yet the standard deviations vary, showing that claims tend to be more volatile while accruals tend to be more predictable overall for this industry in the long term.
While these averages are rather similar to those for the consumer vehicle manufacturers, we see that warranty expenses for commercial vehicles are much more stable in comparison. Generally, these two lines want to stay close to each other, and remain balanced. Lower standard deviations mean less volatility, which is generally a good thing when it comes to warranty expenses.
The 20-year average claims rate for the powertrain manufacturers was 0.92%, with a standard deviation of 0.19%, while the average accrual rate was 0.93%, with a standard deviation of 0.17%.
So if we were to rank these four aspects of the automotive industry, either by average warranty expense rates or by their standard deviations (amount of variation), the hierarchy is: other parts suppliers have the lowest expense rates, powertrain manufacturers are next, then truck and heavy equipment manufacturers, and then cars and other small vehicles at the top. This is not necessarily good or bad, but simply a reflection of how warranties work in these different sectors of the U.S.-based automotive industry.
Warranty Reserve Balances
Lastly, we are going to take a look at the ending balances in the warranty reserve funds of these automotive manufacturers. As we can see in Figure 5 below, those balances hit a new record high in 2022, breaking the industry record for the fourth year in a row.
Figure 5
U.S.-based Automotive OEM & Supplier Warranties
Reserves Held at Year's End
(in US$ millions, 2003-2022)
Total warranty reserve balances for the automotive industry broke the threshold of $30 billion for the first time in 2021. At the end of 2022, total reserves were measured at $31.9 billion, a 5% increase.
The truck and bus manufacturers grew their reserves the most year-over-year. The reserve balance for that industry grew by $478 million, or 9%, to $5.83 billion in 2022. However, the largest portion of these total warranty reserves are held by the car and small vehicle makers. They grew their reserves by $1.1 billion, or 5.3%, to $21.89 billion.
Within the consumer vehicle industry, a large portion of this increase is due to Tesla dramatically increasing the size of its warranty reserve fund over the course of the year. Ford also increased its warranty reserve balance over the year. Among the heavy equipment manufacturers, Deere & Co., Caterpillar, and Paccar, the three largest companies by warranty expenses, all increased their reserve balances.
The powertrain manufacturers also grew their reserves a bit, by just $22 million, or 0.7%, to $3.21 billion. And the other parts suppliers decreased their reserves by $57 million, or -5.5%, to $994 million.
We're delighted to announce the official schedule of events for the highly acclaimed 2nd Annual Global Warranty & Service Contract Innovations, scheduled for April 18-19, 2023, at the Hyatt Regency Long Beach, California. Hear top industry leaders discuss tools and strategies for cross-functional, data-driven new product development, customer service to expand market share and ensure compliance. The all new agenda features riveting case studies and timely panel discussions. Plus, you'll want to participate in the always-popular industry-specific roundtable discussion groups and hot off the press market news flashes from Warranty Week.
To register and view the schedule of events, please visit: www.globalwarrantyinnovations.com.
Register with code WW300 for $300 off, exclusively for Warranty Week subscribers!