U.S. Auto Warranty Expenses:
Warranty metrics stabilized for the U.S.-based small vehicle manufacturers after two tumultuous pandemic years darkened by recalls. Warranty reserve balances and total claims paid reached record highs, while the claims and accrual rates were moderated due to increased product sales across the board.
Zooming in from our 20-year product warranty report, we are starting off with Cars & Cycles, the largest warranty-producing industry in the United States. This includes the U.S.-based passenger car manufacturers, as well as makers of smaller vehicles such as motorcycles, riding lawn mowers, all-terrain vehicles (ATVs), and fishing boats. Generally, our rule of thumb is nothing larger than a pickup truck in the main product line.
The passenger car industry is by far the largest source of warranty expenses, spending $45.89 billion on claims worldwide in 2021. The U.S.-based car manufacturers accounted for only about 15% of that total. However, the U.S.-based companies are also among the first to publish their 2022 annual reports. So while we wait for all the carmakers in Europe, China, Korea, Japan, and India to release their annual numbers this spring and summer, let's look at the U.S. warranty metrics.
Despite the relatively small global footprint, the American passenger car and light truck manufacturers represented roughly 39% of all warranty claims paid in the United States in 2022. The three largest U.S.-based companies in this industry by far are Ford Motor Co., General Motors Co., and Tesla Inc. In fact, Ford and GM were the top two U.S.-based warranty claims payers in 2022, in that order. Tesla ranked seventh in claims payments among all U.S.-based manufacturers.
Historically, Ford and GM used to be joined by Chrysler as the American "Big Three" car companies, but Chrysler actually has not been American-owned for many years. After separating from the German Daimler AG in 2007, the company merged with the Italian Fiat in 2014, forming Fiat Chrysler Automobiles NV. And in turn, that company merged with the French Peugeot SA in 2021, forming the multinational automotive manufacturer Stellantis NV. So we consider Chrysler to be the U.S. arm of a European company, in the same way that Toyota Motor Manufacturing North America is the U.S. arm of an Asian manufacturer.
In addition to Ford, GM, and Tesla, the companies included in this report under the relatively minute "Other" category in Figures 1, 3, and 6 are: Polaris Inc., Toro Co., Harley-Davidson Inc., Hyster-Yale Materials Handling Inc., Lucid Group Inc., Malibu Boats Inc., MasterCraft Boat Holdings Inc., Alamo Group Inc., Federal Signal Corp., and Marine Products Corp.
For each of these companies, we perused their 2022 annual reports to extract our key warranty metrics: total claims paid, total accruals made, and warranty reserves held. We also gathered figures for total automotive sales revenue, and used those data to calculate two ratios: claims as a percentage of sales (the claims rate) and accruals as a percentage of sales (the accrual rate).
Warranty Claims Totals
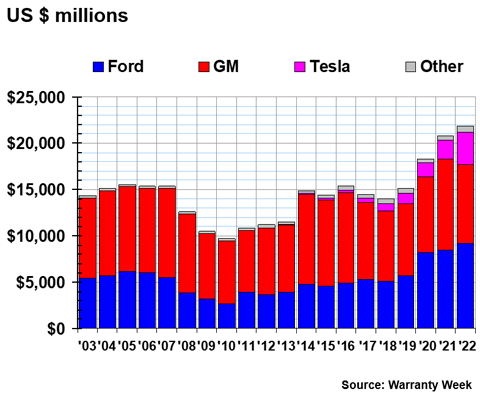
Let's start with warranty claims paid. In calendar 2022, the small vehicle industry as a whole in the United States paid $9.42 billion in claims, a 17% increase from the year prior. This is a new record high in claims paid for this industry, and the first time the total has exceeded $9 billion.
Figure 1
American Auto Manufacturers
Claims Paid per Year
(in US$ millions, 2003-2022)
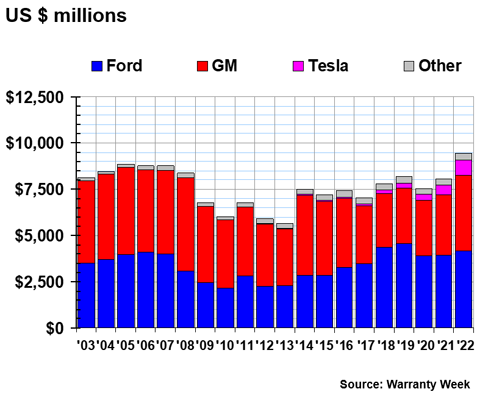
Just Ford, GM, and Tesla together paid out $9.07 billion in claims in 2022, still above that $9 billion record high benchmark. In 2022, Ford paid $4.17 billion in claims, a 5.4% increase from the year prior. GM paid $4.10 billion in claims, a 26.1% increase from 2021. As we will see in Figure 3, much of this increase was the result of two big ongoing recalls announced in 2021, for which GM made large accruals.
Tesla's increase in claims payments was even more dramatic. Tesla's total claims paid rose 53% in just a year, from $525 million to $803 million. However, it looks like the rise in the warranty metrics has been stable relative to its rise in sales, as visualized in Figure 2. For instance, Tesla's product sales revenue increased by 52% from the fourth quarter of 2021 to the same quarter in 2022.
The overarching trend is clearly higher warranty claims payments across the board for the small vehicle manufacturers, though this is tempered by increasing sales as well. These are record totals that seem to go beyond simple "pandemic recovery." In fact, before this year, the old record for highest annual claims in this industry was set in 2007, right before the Great Recession.
Only two companies out of the 14 in this report saw decreases in their total claims paid, and the drops were relatively slight. Those companies were Harley-Davidson, which saw total claims decrease by -4.6% to $38.2 million, and Federal Signal Corp., which saw claims decrease by -6.5% to $7.2 million.
We also see that the Other category is growing, especially due to the introduction of a few new electric vehicle manufacturers that only recently started reporting their warranty data. For example, Lucid Group Inc. started reporting at the beginning of 2022, and paid $11.6 million in claims last year. Hopefully some of the other newer electric vehicle companies will start reporting their warranty data in the coming year so we can paint a fuller picture of the warranty trends in this aspect of the industry.
Another big contributer to this increase was our three small recreational boat companies, MasterCraft Boat Holdings, Malibu Boats, and Marine Products Corp. MasterCraft saw total claims increase by 38%, Malibu Boats by 23%, and Marine Products by 18%. Furthermore, the two manufacturers of tractor attachments in the category saw notable jumps in total claims: Alamo Group Inc. increased by 18%, and Art's Way Manufacturing Co. Inc. increased by a huge 47%. These five companies also saw product sales increase over the year by an average of 21%.
Naturally, higher sales means more accruals and claims payments, so rising totals don't tell the whole story. Our warranty expense rate charts in Figures 2, 4, and 5 give perspective to this story of rising claims and accrual totals by showing this relative to rising product revenue.
Warranty Claims Rates
Figure 2 shows the claims totals for Ford, GM, and Tesla compared to total product sales in each of the 80 quarters over the past 20 years.
Figure 2
American Auto Manufacturers
Warranty Claims Rates
(as a % of sales, 2003-2022)
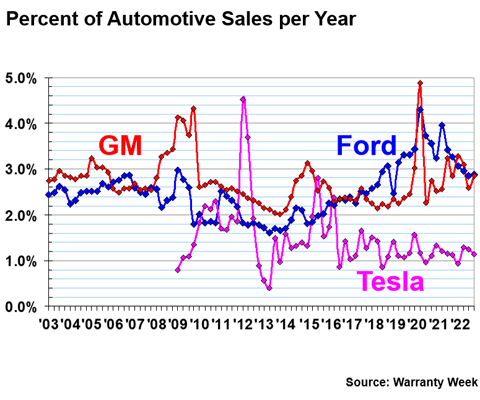
In the fourth quarter of 2022, Ford had a claims rate of 2.9%, GM had a rate of 2.8%, and Tesla 1.1%. Ford's claims rate relative to its product revenue has been sloping downward since the spike in early 2020, which formed due to decreased sales from the beginning of the pandemic. GM's claims rate has been a little more wonky since that 2020 peak, likely due to extra claims from recalls in 2020 and 2021. GM was consistently hovering between 2% and 3% after the Great Recession but before the pandemic, the two "defining" economic events of the past 20 years.
Interestingly, we see here that Tesla actually pays less money in claims relative to total revenue. Of course, we acknowledge that Tesla's vehicle prices average higher than those of Ford or GM. But clearly Tesla has moderated its claims rate over the past decade, especially compared to the dramatic volatility seen in 2012.
Warranty Accrual Totals
In Figure 3, we're looking at the amounts the manufacturers set aside to finance what they believe will be their future warranty expenses. Warranty accruals are made at the time of sale, and are determined by the predictions of the company's experts. So theoretically, accruals should remain proportional to sales, unless there's been a big change in either product reliability or repair cost.
Figure 3
American Auto Manufacturers
Accruals Made per Year
(in US$ millions, 2003-2022)
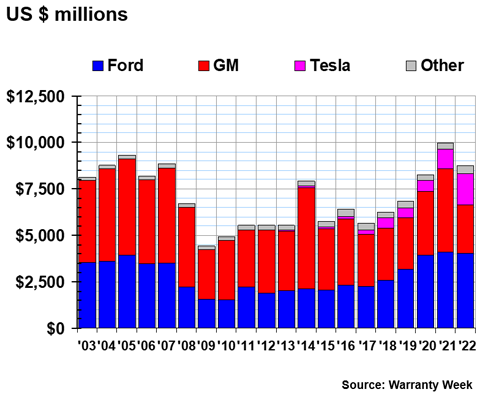
Figure 3 shows us that total accruals for the industry are down, after a new record high was set in 2021. So, it makes sense that we saw a new record high in claims totals in Figure 1. In other words, the heightened accruals made in 2021 accurately predicted the heightened claims in 2022.
Ford's claims total was $4.03 billion in 2022, down just 1.8% from the year prior. Thus Ford remains consistent in its warranty accruals, despite an increase in sales, which is reflected in Figure 4.
GM's accruals were down -42%, a dramatic decrease that is a return to normal accruals after two huge lump sums were put aside in 2020 and 2021 in response to recalls. The first of the two occurred in late 2020, when the United States National Highway Traffic Safety Administration (NHTSA), part of the Department of Transportation, "directed that [GM] replace the Takata Corporation airbag inflators in [the] GMT900 vehicles, which are full-size pickup trucks and SUVs." GM predicts that "the recall will take several years to be completed," and accordingly "recorded a warranty accrual of $1.1 billion for the expected costs of complying with the recall remedy" in the fourth quarter of 2020.
That $1.1 billion accrual was actually surpassed in the following year, when "in July 2021, [GM] issued a voluntary recall for certain 2017-2019 model year Chevrolet Bolt EVs due to the risk that two manufacturing defects present in the same battery cell could cause a high voltage battery fire." In the second quarter of 2021, GM made an accrual of $812 million in response. Then they realized things were worse than predicted, and accrued an additional $1.2 billion in the third quarter. However, it looks like GM filed its own warranty claim with LG Corp., which supplied the batteries. GM received $1.9 billion from LG in the third quarter of 2021, offsetting most of these accruals.
Tesla increased its total accruals by 59.6%, from $1.06 billion in 2021 to $1.69 billion in 2022. As with the increase in claims, this jump is fairly consistent relative to the increase in product revenue over the same period.
A couple of the companies in the "Other" category saw big spikes in their accruals. In fact, all but Harley-Davidson and Federal Signal Corp. saw increases in both claims and accruals in 2022, and all 14 saw increases in product revenue.
Marine Products and MasterCraft Boat both saw their accruals increase at a rate outpacing sales growth. Marine Products' accruals rose by 50% to $5.73 million, while sales rose by 28%; MasterCraft's accruals rose by 50% to $15.93 million, while sales only rose by 19%. Polaris Inc., which mainly makes snowmobiles, ATVs, and motorcycles, saw accruals rise by 40% to $183.5 million, though sales only rose by about 5%.
Warranty Accrual Rates
As we see, increases in total accruals on their own are not necessarily bad news, since higher accruals can represent the same amount accrued per vehicle, but higher sales overall. Figure 4 shows total accruals as a ratio compared to total product sales for the three large U.S.-based passenger vehicle companies, Ford, GM, and Tesla.
Figure 4
American Auto Manufacturers
Warranty Accrual Rates
(as a % of sales, 2003-2022)
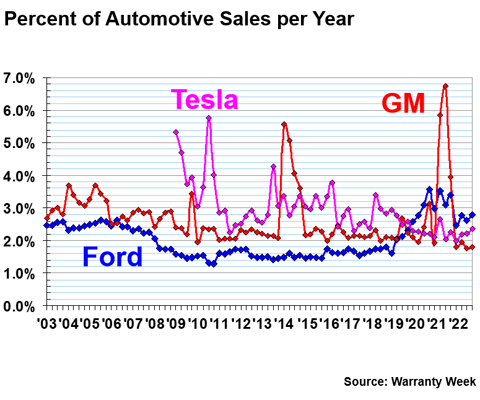
In the fourth quarter of 2022, Ford had an accrual rate of 2.8%, GM had a rate of 1.8%, and Tesla 2.4%.
Ford has shown the most consistency overall, especially between the two expense rates. We saw in Figure 2 that its claims rate was 2.9% in the fourth quarter, showing that claims and accruals are both similarly proportional to sales. They're not accruing excess money into their warranty reserve account; rather, claims and accruals just about match each other, though the claims total slightly exceeded the accrual total in 2022.
The most notable spike shows the three big accruals GM made in response to product recalls in 2020 and 2021. The other big spike in GM's line was the 2014 ignition key recall, which was another huge warranty expense for the company. Unfortunately, these more recent recalls were a confluence of the sales dip at the beginning of the pandemic and two separate product issues arising within a year.
We also see that Tesla struggled to predict its warranty claims payments in the first few years that the company reported its warranty data. This line has smoothed a lot in the past five years or so, showing more accurate predictions of costs per vehicle sold.
Warranty Expense Rate Trends
With that said, we are going to take a look at the average claims and accrual rates for the small vehicle industry over the past 20 years.
Figure 5
American Auto Manufacturers
Average Claims and Accrual Rates
(as a % of sales, 2003-2022)
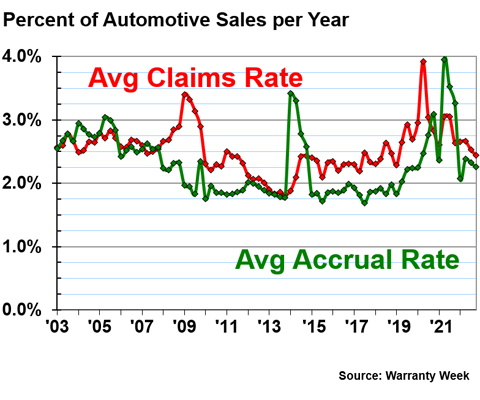
The first thing that is immediately obvious is that GM's 2014 and 2021 recalls made huge waves across the industry. This is no surprise from one of the two largest passenger car companies in the United States. We can also clearly see the feedback relationship between accruals and claims, with the claims rate spiking, albeit less so, soon after the peaks in the accrual rate.
However, we see that the years of the Great Recession are an exception to this. The claims rate exceeded the accrual rate from 2008 until 2012, with the biggest difference between the two rates occurring in early 2009, when the stock market hit its bottom for the recession. In contrast, the periods 2003-2007, 2012-2014, and 2015-2019 show what calm and consistent economic times should look like, with the lines smooth and stable and the two metrics right on top of each other.
There is a clear difference between the two five-year periods of stability in this chart; namely, their height on the y-axis. In the period from 2003 to 2007, the average claims rate was 2.63%, with a range of 2.47% - 2.83%, and the average accrual rate was 2.70%, with a range of 2.43% - 3.04%. On the other hand, from 2015 to 2019, the average claims rate was 1.35%, with a range of 1.24% - 1.48%, and the average accrual rate was 1.26%, with a range of 1.14% - 1.38%. It is really remarkable that the average expense rates for the industry were more than a percentage point lower in the more recent stable period. This shows that the industry as a whole has driven down warranty expenses rather significantly in recent years. Warranty expenses represent a smaller portion of total sales revenue in this industry than they did 20 years ago when the manufacturers started reporting these data. Of course, this trend was interrupted in 2021, and it looks like the average rates are moderating back down to around the same levels we saw them back in the mid-2000s. It will be interesting to see whether these rates continue to hover at these levels, or go back down to the pre-pandemic trend.
Warranty Reserve Balances
Our final warranty metric is the balance left at the end of each year in the warranty reserve funds of the automakers. In Figure 6, we see that warranty reserves have dramatically increased in the past three years. 2022 exceeded 2021's record high.
Figure 6
American Auto Manufacturers
Reserves Held at Year's End
(in US$ millions, 2003-2022)
Ford has the largest warranty reserve balance in the industry, with a total of $9.19 billion set aside in the fund. Based on the fourth quarter claims data, Ford currently has 25 months of claims payments set aside in this reserve fund.
GM's reserves are not much smaller, with a total of $8.53 billion in its fund. Based on the claims it paid in the fourth quarter, GM also has 25 months of payments currently set aside.
We see in Figure 6 that Tesla has visibly increased its warranty reserve balance. This mainly seems to be the result of a large increase in accruals in the fourth quarter of 2022, most of which appears to have been deposited rather than going directly to claims payments. In the third quarter of 2022, Tesla's warranty reserve total was $2.77 billion. The company accrued $626 million in just the fourth quarter, around the same as the sum of the first two quarters of the year. Its final reserve total was $3.51 billion at the end of that quarter.
In fact, Tesla's accruals far exceeded its claims payments in 2022. As we saw in Figure 3, the company accrued $1.69 billion in 2022, and as we saw in Figure 1, total claims paid for 2022 was $803 million. The difference between these two numbers is naturally the contribution to the warranty reserve fund. We highlight this because it is a puzzling disparity between the two metrics compared to the other big companies in the industry; no explanation for the increased accruals was offered in the company's 2022 annual report. Based on the fourth quarter data, Tesla has 46 months of claims payments currently put away in its reserve fund. It will be interesting to see how this evolves in the coming year.