U.S. Auto Parts & Powertrain Warranty Expenses:
The warranty expense rates of non-powertrain parts suppliers are more stable over time, but total warranty costs rose more for this group compared to the industry average. In 2025, U.S.-based auto parts suppliers paid $2.18 billion in warranty claims, set aside $2.09 billion in accruals, and held $4.94 billion in reserves.
We've returned from hiatus, and we're continuing our analysis of the warranty expenses of U.S.-based vehicle manufacturers. This week, we're examining 23 years of warranty expenses for U.S.-based auto parts suppliers, including Tier 1 and Tier 2 suppliers, aftermarket parts distributors, and auto parts retailers.
We've seen OEMs of light-, medium-, and heavy-duty vehicles increase their diligence in supplier recovery in recent years. In the Chevy Bolt battery recall, General Motors recovered $2.7 billion in claims costs from LG, its battery supplier, about 90% of the total cost of the recall. This is an area that many OEMs are looking to in order to reduce and recoup warranty costs.
The roster of U.S.-based auto OEMs is much smaller than the list of auto parts suppliers. However, the suppliers tend to have lower warranty expense rates, since their relative lack of contact with the end-user means they often deal with a smaller volume of warranty claims.
Furthermore, we split the auto parts suppliers into two groups: the makers of powertrain components, and the makers of other auto parts. Typically, powertrain suppliers have higher warranty expense rates than other auto parts manufacturers, since powertrain components are sold directly to end-users, such as truck owner-operators and trucking logistics companies.
Ultimately, it's about who's on the receiving end of each warranty claim. In consumer vehicles, OEMs receive all of the claims. In commercial vehicles, vehicle frame OEMs receive claims, as do manufacturers of the powertrain components, including the engine, transmission, and chassis, which are usually sold separately. After paying the claims, the OEMs have the option to pass on the warranty costs to their Tier 1 suppliers; each manufacturer has its own processes and criteria to determine if supplier recovery is worth it.
Total warranty claims, accruals, and reserves all increased for the auto parts manufacturers from 2024 to 2025. Costs were up a little more for the other auto parts manufacturers, compared to the powertrain manufacturers.
In total, we found 136 U.S.-based auto parts manufacturers, of which 55 reported warranty expenses in 2025.
Based on warranty expenses, the largest U.S. based auto parts manufacturers were: Cummins Inc., O'Reilly Automotive Inc., Standard Motor Products Inc., Westinghouse Air Brake Technologies Corp. (WABTECH), Brunswick Corp., BorgWarner Inc., LKQ Corp., Dana Inc., Aptiv plc, Eaton Corp. plc, Illinois Tool Works Inc., LCI Industries, Allison Transmission Holdings Inc., and Visteon Corp.
We perused the annual reports and quarterly financial statements of each auto parts manufacturer, and extracted three key warranty metrics: the amount of claims paid, the amount of accruals made, and the end-balance of the warranty reserve fund.
In addition, we gathered data on each manufacturer's segments product sales revenue, excluding proceeds from financing, extended warranty, etc. Using these data, we calculated our two warranty expense rates: claims as a percentage of sales revenue (the claims rate), and accruals as a percentage of sales (the accrual rate).
Warranty Claims Totals
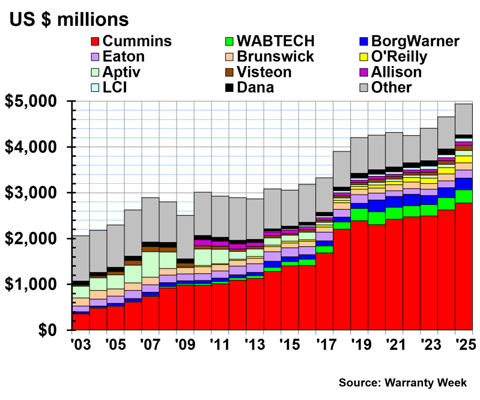
Figure 1 shows the total warranty claims paid by the U.S.-based auto parts manufacturers, from 2003 to 2025.
Figure 1
U.S.-based Auto Parts & Powertrain Manufacturers
Claims Paid per Year
(in millions of U.S. dollars, 2003-2025)
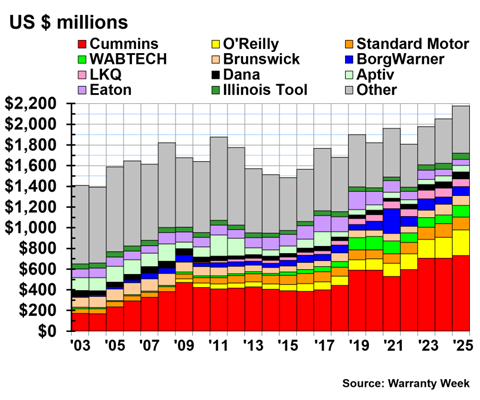
In 2025, the U.S.-based auto parts manufacturers paid a total of $2.18 billion in warranty claims, a 6% increase from 2024.
The powertrain suppliers paid $1.13 billion in claims in 2025, a 3% increase from 2024. The other auto parts suppliers paid $1.05 billion in claims, an 8% increase.
Cummins, the largest U.S.-based powertrain manufacturer, paid $730 million in warranty claims in 2025, a 4% increase from 2024. O'Reilly, a parts retailer, paid $250 million in claims, a 23% increase. Standard Motor Products, an aftermarket parts distributor, paid $124 million in claims in 2025, a -5% decrease.
Westinghouse Air Brake Technologies, or Wabtec, which makes rail brake systems and locomotives, paid $110 million in claims, a 29% increase. Brunswick Corp., which makes marine engines and parts, paid $97 million in warranty claims in 2025, a -5% decrease.
On the powertrain side, BorgWarner paid $86 million in claims, a 21% increase from the year prior. LKQ paid $74 million, a -13% decrease. Dana paid $68 million, an 11% increase. Eaton paid $60 million, a -8% decrease.
Aptiv, a maker of vehicle electronics that was spun off from GM in 1999, paid $62 million in warranty claims in 2025, a 9% increase. Illinois Tool Works, which makes fasteners, paid $60 million in claims, a 3% increase.
Shoals Technologies Group Inc. paid $41 million in warranty claims, a 41% increase. Allison Transmission paid $38 million, a -7% decrease. Visteon paid $30 million, a 36% increase. Regal Rexnord Corp. paid $29 million, a 32% increase. Stoneridge Inc. paid $23 million, a 73% increase. And Garrett Motion Inc. paid $20 million, a 54% increase.
Warranty Accrual Totals
Figure 2 shows the total warranty accruals made by the auto parts manufacturers, from 2003 to 2025.
Figure 2
U.S.-based Auto Parts & Powertrain Manufacturers
Accruals Made per Year
(in millions of U.S. dollars, 2003-2025)
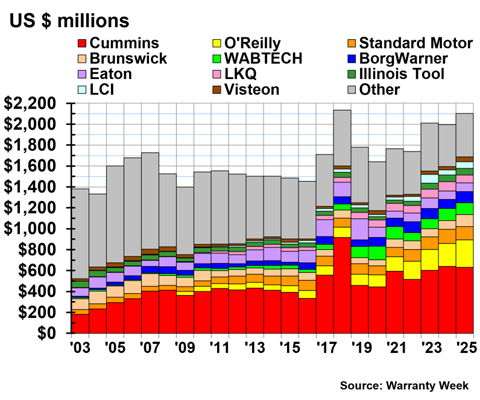
The U.S.-based auto parts manufacturers set aside $2.09 billion in warranty accruals in 2025, a 4% increase from 2024.
The powertrain manufacturers set aside $1.06 billion in warranty accruals in 2025, a 1% increase. Other auto parts suppliers set aside $1.03 billion in accruals, a 7% increase.
Cummins set aside $632 million in warranty accruals in 2025, a -1% decrease from 2024. O'Reilly set aside $263 million in accruals, a 20% increase. Standard Motor Products set aside $127 million, a -6% decrease. Brunswick set aside $114 million, a 37% increase. Wabtec set aside $112 million, a -4% decrease.
In the powertrain industry, BorgWarner set aside $108 million in warranty accruals, a 27% increase from the year prior. Eaton set aside $82 million, a 1% increase. LKQ set aside $76 million, -15% decrease. Visteon set aside $47 million, a 42% increase. Dana set aside $41 million, a -23% decrease. And Allison Transmission set aside $35 million, a 6% increase.
Illinois Tool Works set aside $63 million in warranty accruals, the same as the year prior. LCI set aside $63 million, a -2% decrease. Aptiv set aside $44 million, a 33% increase. Lear Corp. set aside $27 million in accruals in 2025, triple the amount it accrued in 2024. And Regal Rexnord set aside $22 million, a 3% increase.
Warranty Expense Rates
Figures 3 and 4 show the quarterly warranty claims and accrual rates for the powertrain and other auto parts manufacturers, respectively, from 2003 to 2025.
Figure 3
U.S.-based Powertrain Manufacturers
Average Claims and Accrual Rates
(as a % of product sales, 2003-2025)
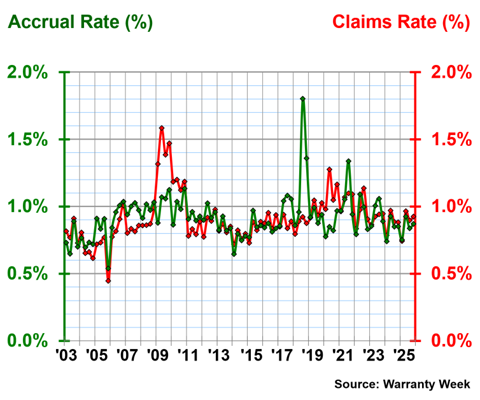
Over 23 years, the powertrain manufacturers had an average warranty claims rate of 0.91%, with a standard deviation of 0.18%, and an average warranty accrual rate of 0.92%, with a standard deviation of 0.16%.
In 2025, the powertrain manufacturers had an average warranty claims rate of 0.88%. The quarterly percentages ranged from 0.74% in the first quarter, to 0.97% in the second quarter.
The powertrain manufacturers had an average warranty accrual rate of 0.85% in 2025. The quarterly rates ranged from 0.75% in the first quarter, to 0.92% in the second quarter.
Figure 4
U.S.-based Auto Parts Manufacturers
Average Claims and Accrual Rates
(as a % of product sales, 2003-2025)
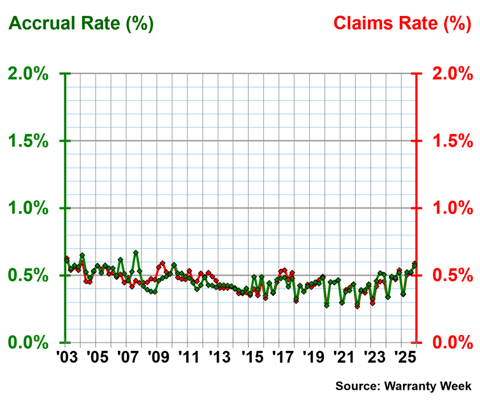
Over 23 years, the other auto parts manufacturers had an average warranty claims rate of 0.46%, with a standard deviation of 0.08%, and an average warranty accrual rate of 0.46%, with a standard deviation of 0.08%.
We can see that the warranty expense rates for the other auto parts manufacturers are much more consistent and stable over time, demonstrated by the lower standard deviations for the 23-year averages.
In 2025, the other auto parts manufacturers had an average warranty claims rate of 0.49%. The quarterly rates ranged from 0.36% in the first quarter, to 0.59% in the fourth quarter.
The other auto parts manufacturers had an average warranty accrual rate of 0.50% in 2025. The quarterly rates ranged from 0.36% in the first quarter, to 0.57% in the fourth quarter.
Comparing Figures 3 and 4, we can see that the powertrain manufacturers spend about twice the proportion of product sales revenue on warranty costs, compared to the other auto parts manufacturers.
Warranty Reserve Balances
Figure 5 shows the year-end balances of each auto parts manufacturer's warranty reserve fund, from 2003 to 2025.
Figure 5
U.S.-based Auto Parts & Powertrain Manufacturers
Reserves Held per Year
(in millions of U.S. dollars, 2003-2025)
The U.S.-based auto parts manufacturers held a total of $4.94 billion in warranty reserves at the end of calendar 2025, a 6% increase from the end of 2024.
The powertrain suppliers held $3.66 billion in warranty reserves, a 6% increase. The other auto parts suppliers held $1.28 billion in reserves, a 5% increase.
At the end of calendar 2025, Cummins held $2.78 billion in warranty reserves, a 6% increase from the end of 2024. Wabtec held $289 million in reserves, a 5% increase. BorgWarner held $254 million, an 18% increase.
Eaton held $174 million in reserves at the end of 2025, a 16% increase. Brunswick held $162 million, a 6% increase. O'Reilly held $146 million, a 10% increase. Aptiv held $122 million, a 65% increase. Visteon held $107 million, a 34% increase.
Allison Transmission held $84 million in reserves, a 25% increase from the end of the year prior. LCI held $76 million, a 16% increase. Dana held $71 million, a -42% decrease.
Dauch Corp. held $63 million in reserves, a 4% increase. Illinois Tool Works held $57 million, a 10% increase. AutoZone Inc. held $45 million, a -4% decrease. LKQ held $41 million, a 5% increase. Lear Corp. held $40 million in reserves, a 46% increase.
Check out the rest of our series of 23-year charts:
- 23rd Annual Product Warranty Report
- U.S. Passenger Vehicle Warranty Expenses
- U.S. Truck & Bus Warranty Expenses