23rd Annual Product Warranty Report:
In 2025, the average U.S. product warranty claims rate was 1.30%, and the average accrual rate was 1.43%. Collectively, over $30 billion was paid in product warranty claims, $33 billion was set aside in warranty accruals, and $72 billion was held in warranty reserves.
In 2025, U.S.-based manufacturers paid a total of $30.37 billion in warranty claims, an increase of 4% from 2024. They set aside $33.41 billion in warranty accruals, an increase of 7%. They held $71.89 billion in warranty reserves at the end of 2025, an unprecedented 17% increase from the end of 2024.
For the twenty-third year, we present our annual report on the product warranty expenses of all U.S.-based manufacturers. These data encompass all of the limited warranty expenses reported by manufacturers that are publicly traded in the United States — with the caveat that not every manufacturer follows the rules and reports its warranty costs.
The U.S. Securities and Exchange Commission (SEC) deadline for filing 10-K annual reports was March 3 for large companies, and March 31 for all filers. 99.8% of the data are in, and the largest of the few remaining non-reporters either went private, declared bankruptcy, or got acquired.
The SEC and Financial Accounting Standards Board (FASB) Accounting Standards Codification (ASC) require all companies publicly trading in the United States to disclose the amounts they pay in warranty claims, set aside in warranty accruals, hold in warranty reserves, and add or subtract in changes of estimate to previous accruals.
Almost every manufacturer follows these guidelines, with a few notable exceptions in the high tech sector, namely Apple, Microsoft, and Google. Furthermore, there are many "American" brands that are now owned by foreign-based parent companies, including GE Appliances (owned by Haier, based in China), Chrysler (owned by Stellantis, based in the Netherlands), and Frigidaire (owned by Electrolux, based in Sweden).
Methodology
The FASB first recommended that manufacturers report their product warranty expenses in 2003. Since then, Warranty Week has been capturing these data from annual reports and quarterly financial statements.
From each U.S.-based manufacturer's financial reports, we gathered three key warranty metrics: the amount of claims paid, the amount of accruals made, and the end-balance of the warranty reserve fund.
In addition, we gathered data on each manufacturer's segmented product sales revenue. We gather these data from either the income statement or the revenue segmentation footnotes, so we can identify a figure that best represents the revenue generated from the sale of products that come with manufacturer's warranties attached, excluding other sources of revenue such as extended warranty, repair services, apparel sales, mortgages, etc.
Using these data, we calculate our two warranty expense rates: claims as a percentage of product sales revenue (the claims rate), and accruals as a percentage of sales (the accrual rate).
Each of the over 1,400 warranty-issuing, U.S.-based manufacturers reported warranty expenses for at least some period from 2003 to 2025, but not all reported in 2025.
Based on their primary product line, each manufacturer in this report was assigned to one of three sectors: vehicles, electronics, or building trades. Within those sectors, each company was assigned to one of 18 possible industry groups.
The deadline to file annual reports with the SEC was March 31, but as of April 1, there were still a handful of small manufacturers that were late to report. These companies represent under 0.2% of warranty claims and accruals.
A few larger manufacturers ceased reporting in 2025. Spirit AeroSystems Holdings Inc. was re-acquired by Boeing in December 2025, with some assets transferred to Airbus as part of the transaction. iRobot Corp. filed for Chapter 11 bankruptcy in December 2025, and was acquired by Shenzhen Picea Robotics, its primary contract manufacturer based in China.
Vehicle Warranty Accruals
In total, U.S.-based manufacturers set aside $33.41 billion in warranty accruals, a 7% increase from 2024.
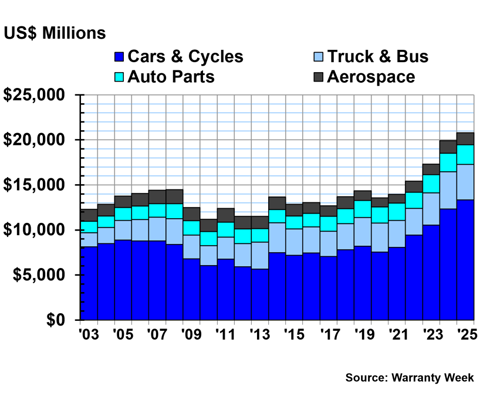
The vehicle sector accounted for 65% of accruals, a total of $21.74 billion across four industry groups.
The four industry groups in the vehicle sector are: Cars & Cycles, which includes manufacturers of passenger cars, motorcycles, boats, ATVs, and other light-duty vehicles; Truck & Bus, which includes manufacturers of agricultural and construction equipment, as well as heavy-duty, on-highway trucks; Auto Parts, including suppliers of powertrain components, Tier 1 suppliers, and Tier 2 suppliers; and Aerospace, including airframe OEMs, jet engine manufacturers, and avionics parts suppliers.
Figure 1 shows the total annual warranty accruals made by the U.S.-based vehicle sector, across four industry groups, from 2003 to 2025.
Figure 1
Worldwide Warranty Accruals Made
by U.S.-based Vehicle Manufacturers
(accruals made in US$ millions, 2003-2025)
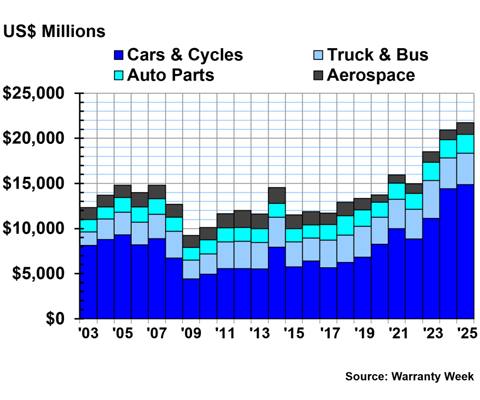
The Cars & Cycles group set aside a total of $14.88 billion in warranty accruals during 2025, a 3% increase from 2024.
We will be diving into the expenses of this whole industry in our next newsletter, but you can take a look at our March 12, 2026 newsletter "U.S. Auto Warranty Expenses" for analysis of the 2025 warranty costs of the largest U.S.-based passenger car OEMs.
2025 was the third year in a row that the Cars & Cycles manufacturers increased the amount of warranty accruals they set aside, due to increasing costs for parts and labor, and the threat of tariffs and labor shortages driving costs up higher. In fact, we saw total warranty accruals increase across all four industry groups in the vehicle sector from 2024 to 2025, for the same reasons.
The Truck & Bus group set aside $3.47 billion in warranty accruals in 2025, a 1% increase from 2024. The Auto Parts manufacturers set aside $2.09 billion in accruals in 2025, an increase of 4% from the year prior.
The U.S. Aerospace industry set aside $1.30 billion in warranty accruals in 2025, a 21% increase from the year prior.
Electronics Warranty Accruals
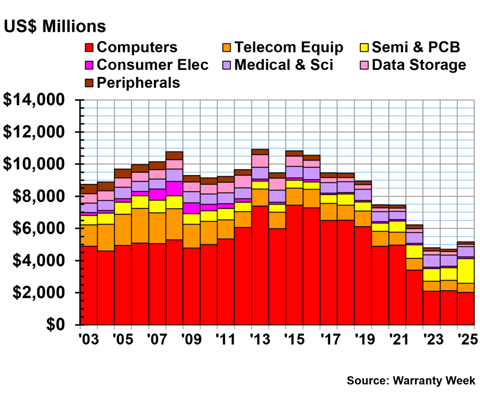
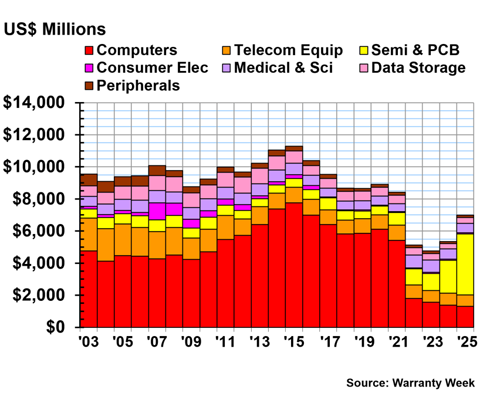
The high-tech electronics sector set aside $7.05 billion in accruals in 2025, representing 21% of the U.S. total.
The electronics sector is comprised of seven industry groups: Computers, Telecom Equipment, Semiconductors & PCB, Consumer Electronics, Medical & Scientific Equipment, Data Storage, and Peripherals.
Figure 2 shows the total warranty accruals made by each of the seven industry groups in the electronics sector, from 2003 to 2025.
Keep in mind that we can only collect product warranty data that are reported to the SEC. Thus, our data from Microsoft end in 2013, and our data from Apple end in 2022, and we have no data from Google.
Figure 2
Worldwide Warranty Accruals Made
by U.S.-based Electronics Manufacturers
(accruals made in US$ millions, 2003-2025)
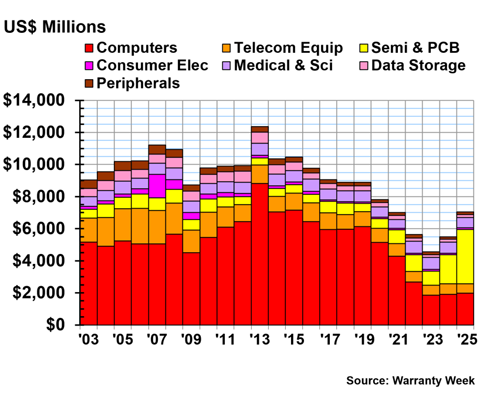
The semiconductor & PCB industry set aside an unprecedented $3.37 billion in warranty accruals in 2025, a steep 87% increase from 2024's total of $1.80 billion. This is a significant rise in the warranty accruals set aside by the U.S. semiconductor industry, especially considering that accruals doubled from 2023 to 2024. Overall, warranty accruals in the semiconductor industry nearly quadrupled over just two years, from 2023 to 2025.
We will do a deep dive into the warranty expenses of the semiconductor & PCB industry in an upcoming newsletter. In last week's newsletter, "Discrete GPU Warranty Expenses," we examined the warranty expenses of two major players in the semiconductor industry, Nvidia and Advanced Micro Devices (AMD). These two GPU manufacturers, which make chips essential to powering language learning models, both saw huge increases in their warranty costs in 2025.
Demand for GPUs to power AI only continues to grow. GPU prices are soaring, especially due to the recent shortage of random access memory (RAM), but chip sales continue to be very strong. Higher overall repair costs come naturally with higher sales. However, it seems that repair costs are also increasing per unit, likely due to tariffs, since the vast majority of chips are fabricated in China or Taiwan, along with the RAM shortage affecting parts costs.
The telecom equipment manufacturers set aside $596 million in warranty accruals in 2025, a -9% decrease from 2024. The medical and scientific equipment manufacturers set aside $638 million in accruals, a -7% decrease.
The manufacturers in the computers industry set aside $1.97 billion in warranty accruals in 2025, a 3% increase from 2024.
The U.S.-based consumer electronics industry set aside $117 million in warranty accruals in 2025, a 14% increase from 2024. Due to a bit of accounting non-compliance from certain large manufacturers, Garmin and GoPro were the largest consumer electronics manufacturers that reported their limited warranty expenses.
The data storage manufacturers set aside $183 million in warranty accruals in 2025, a 3% increase from 2024. The peripherals industry set aside $168 million in accruals, a 14% increase.
Building Trade Warranty Accruals
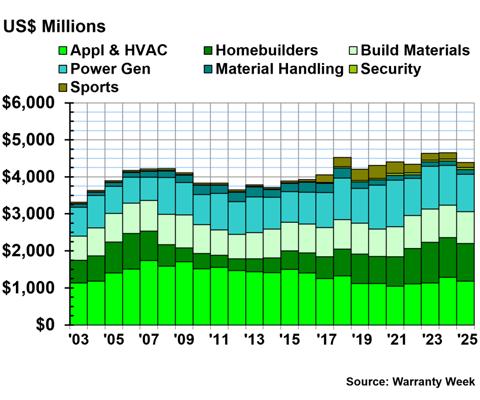
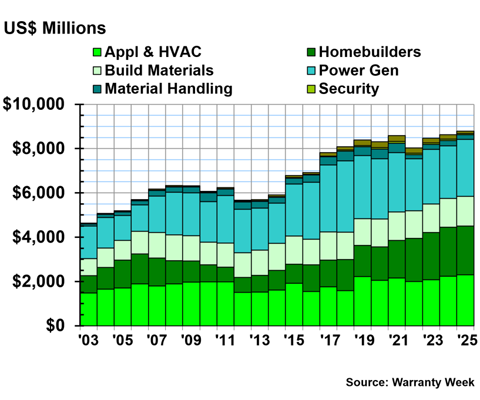
The building trades sector set aside a total of $4.62 billion in warranty accruals, accounting for 14% of all U.S. product warranty accruals in 2025.
The building trades sector is comprised of seven industry groups: Appliances & HVAC, Homebuilders, Building Materials, Power Generation Equipment, Materials Handling, Security, and Sports.
The Security industry mainly consists of makers of surveillance cameras, and makers of firearms. The Sports category includes manufacturers of recreational equipment including hunting and camping gear, golf clubs, dart boards, ping-pong tables, exercise machines, and in-ground swimming pools. In addition, a few companies fall into the Sports industry as a bit of catch-all for products that come with limited warranties, but are a bit more difficult to categorize, including jewelry, watches, crafting machines, e-cigarettes, vapes, and indoor cannabis cultivation equipment.
Figure 3 shows the total warranty accruals set aside by the manufacturers in the building trades, from 2003 to 2025.
Figure 3
Worldwide Warranty Accruals Made
by U.S.-based Building Trade Manufacturers
(accruals made in US$ millions, 2003-2025)
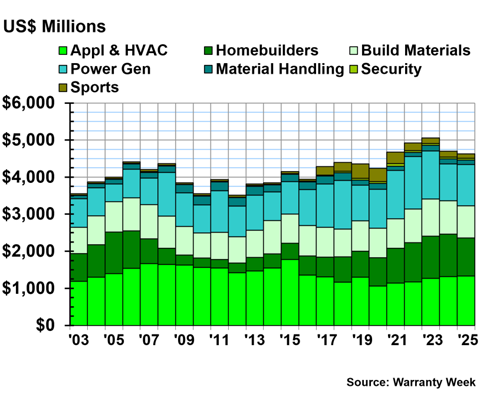
The appliance & HVAC manufacturers set aside $1.33 billion in warranty accruals in 2025, a 1% increase from 2024.
The homebuilders set aside $1.03 billion in warranty accruals in 2025, a -10% decrease from the year prior. Take a look at our March 26, 2026 newsletter "New Home Builder Warranty Expenses" for a deeper dive into the warranty expenses of this industry.
The building materials manufacturers set aside $868 million in warranty accruals in 2025, a -3% decrease from 2024.
The power generation equipment manufacturers set aside $1.12 billion in warranty accruals in 2025, a 12% increase. 2025 was the second year of reporting since General Electric spun off its power generation business as GE Vernova in April 2024.
The material handling industry set aside $117 million in warranty accruals in 2025, a -15% decrease from 2024. The sports industry set aside $117 million in accruals, a -27% decrease. And the security industry set aside $45 million in accruals, a -13% decrease.
Warranty Expense Rates
Especially in recent years, with U.S. dollar inflation driving up the prices of both products and product repairs, total warranty expenses only tell part of the story.
Warranty accruals are supposed to remain in proportion to product sales, unless there's been a significant change in reliability or repair cost. Ideally, warranty claims payments will remain proportional to product sales revenue as well.
Because these warranty metrics are ratios, the impact of inflation should be minimized. Figure 4 can reveal to us if the 7% increase in total U.S.-based warranty accruals, and the 4% increase in warranty claims, is in proportion to increases in product sales revenue, or if warranty is costing manufacturers a larger proportion of their total revenue.
Figure 4 shows the average quarterly warranty claims and accrual rates across all U.S.-based manufacturers that issue limited warranties with their products, from 2003 to 2025.
Figure 4
All U.S.-based Companies
Average Warranty Claims & Accrual Rates
(as a % of product sales, 2003-2025)
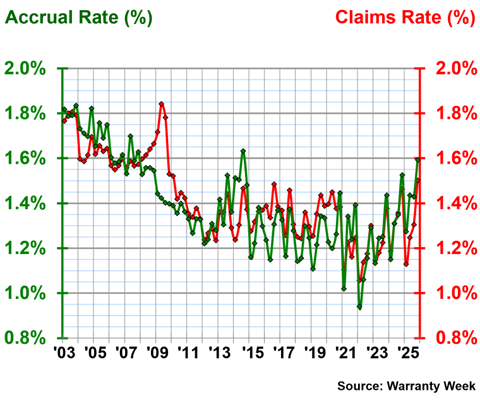
Over 23 years, the average warranty accrual rate was 1.40%, with a standard deviation of 0.20%, and the average warranty claims rate was 1.42%, with a standard deviation of 0.18%.
In 2025, the average warranty accrual rate was 1.43%. The quarterly rates ranged from 1.27% in the first quarter, to 1.59% in the fourth quarter.
The average warranty claims rate was 1.30% in 2025. The quarterly rates ranged from 1.13% in the first quarter, to 1.50% in the fourth quarter.
Warranty Claims Totals
Manufacturers choose how much they set aside in warranty accruals, so we've highlighted the metric in this newsletter. The following three charts show the total warranty claims paid by U.S.-based manufacturers from the three industry sectors.
In 2025, U.S.-based manufacturers paid a total of $30.37 billion in limited warranty claims, a 4% increase from 2024.
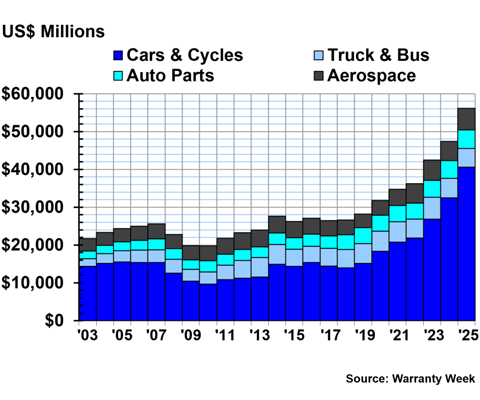
The vehicle sector paid $20.81 billion in warranty claims in 2025, 69% of the overall total. Figure 5 shows the total warranty claims paid by the four industries in the vehicle sector, from 2003 to 2025.
Figure 5
Worldwide Warranty Claims Paid
by U.S.-based Vehicle Manufacturers
(claims paid in US$ millions, 2003-2025)
The cars & cycles manufacturers paid $13.35 billion in warranty claims in 2025, an 8% increase from 2024. The truck & bus industry paid $3.94 billion in claims in 2025, a -5% decrease.
The auto parts manufacturers paid $2.18 billion in claims, a 6% increase from the year prior. The aerospace manufacturers paid $1.34 billion in claims, a -4% decrease.
Figure 6 shows the total warranty claims paid by the manufacturers in the electronics sector, from 2003 to 2025.
Figure 6
Worldwide Warranty Claims Paid
by U.S.-based Electronics Manufacturers
(claims paid in US$ millions, 2003-2025)
Warranty claims paid by semiconductor & PCB manufacturers doubled from 2024 to 2025. In 2025, the semiconductor industry paid $1.53 billion in warranty claims.
The computer manufacturers paid $2.02 billion in warranty claims in 2025, a -5% decrease from 2024. The medical & scientific equipment manufacturers paid $644 million in claims, a -8% decrease. The telecom equipment manufacturers paid $565 million in claims, a -13% decrease.
The consumer electronics manufacturers paid $108 million in claims in 2025, a 9% increase from 2024. The peripherals industry paid $160 million in claims, a 5% increase. The data storage industry paid $143 million in claims, a -34% decrease.
Figure 7 shows the total warranty claims paid by the building trades sector, from 2003 to 2025.
Figure 7
Worldwide Warranty Claims Paid
by U.S.-based Building Trade Manufacturers
(claims paid in US$ millions, 2003-2025)
The appliance & HVAC manufacturers paid $1.18 billion in warranty claims in 2025, a -8% decrease. The homebuilders paid $1.01 billion in claims, a -5% decrease. The building materials manufacturers paid $864 million in claims, a -1% decrease.
The power generation equipment manufacturers paid $1.01 billion in warranty claims in 2025, a -6% decrease from the year prior.
The material handling manufacturers paid $129 million in claims, an 8% increase. The security manufacturers paid $52 million, a -6% decrease. And the sports manufacturers paid $135 million in claims, a -18% decrease.
Warranty Reserve Balances
Our final metric is the year-end balance of each manufacturer's warranty reserve fund.
As of December 31, 2025, the limited warranty-issuing, U.S.-based manufacturers held a total of $71.89 billion in warranty reserves, a 17% increase from the end of 2024. That's over $10 billion added to U.S. warranty reserves in just one year.
The vehicle sector accounted for 78% of that total. Figure 8 shows the total warranty reserves held by the vehicle sector, from 2003 to 2025.
Figure 8
Worldwide Warranty Reserves
Held by U.S.-based Vehicle Manufacturers
(reserves held in US$ millions, 2003-2025)
The cars & cycles industry held $40.57 billion in warranty reserves at the end of 2025, a steep 25% increase from the end of 2024.
The aerospace industry held $5.67 billion in warranty reserves at the end of 2025, a 13% increase. The truck & bus industry held $4.94 billion in reserves, a -5% decrease. And the auto parts industry held $4.94 billion in reserves, a 6% increase.
Figure 9 shows the warranty reserves held by the electronics sector, from 2003 to 2025.
Figure 9
Worldwide Warranty Reserves
Held by U.S.-based Electronics Manufacturers
(reserves held in US$ millions, 2003-2025)
The semiconductor industry held $3.80 billion in warranty reserves at the end of 2025, an 85% increase from the end of 2024. The computer manufacturers held $1.30 billion in reserves, a -6% decrease.
The telecom equipment manufacturers held $723 million in warranty reserves at the end of 2025, a -2% decrease. The medical & scientific equipment manufacturers held $582 million in reserves, a -8% decrease.
The data storage manufacturers held $364 million in reserves, a 10% increase. The peripherals manufacturers held $145 million in reserves, a 2% increase. The consumer electronics manufacturers held $78 million, a 12% increase.
Figure 10 shows the reserves held by the building trades sector, from 2003 to 2025.
Figure 10
Worldwide Warranty Reserves
Held by U.S.-based Building Trade Manufacturers
(reserves held in US$ millions, 2003-2025)
At the end of 2025, the power generation equipment manufacturers held $2.57 billion in warranty reserves, a 9% increase. The appliance & HVAC manufacturers held $2.30 billion in reserves, a 3% increase. The homebuilders held $2.20 billion in reserves, a -1% decrease.
The building materials industry held $1.34 billion in reserves, a 3% increase. The material handling industry held $216 million, a 9% increase. The sports manufacturers held $102 million, a -47% decrease. And the security industry held $49 million, a -30% decrease.