Mid-Year New Home Warranty Report:
Total warranty claims, accruals, and reserves hit new record highs during the last three quarters. New homes and housing developments are popping up all over the place, but the country's housing stock remains low. As more homes are built quickly, warranty work and good warranty accounting are more important than ever for the new home builders.
If you were to ask the major U.S.-based new home builders, they'd likely say there's no recession. Mortgage interest rates and home prices are still soaring, but consumers don't seem to be deterred from making the big purchases. And housing supply is still low, spurring the new home builders to transform just about any empty plot of land into a new housing development.
Anecdotally, we've seen this to be true. Driving around suburban central Pennsylvania this summer, we noticed new housing developments under construction all over the place, with newly built three-bedroom attached townhomes advertised starting at $400,000. We even visited a new housing development attached to a new strip-mall, still under construction but already populated with a craft brewery, third-wave coffee shop, and a specialty soap store, as well as a swimming pool at the community's clubhouse. Occupied new homes with shiny pick-up trucks out front abutted active construction sites, which would soon be filled with more new families. We drove past two others in the same town, nearly identical, though one lacks a strip mall, and one has an active cemetery in its backyard.
Since early 2003, we have collected warranty expense data from all of the publicly-traded new home builders based in the United States. Keep in mind that the home builders we track account for approximately one-third of new residential construction in the United States, though it's hard to directly compare totals due to the U.S. Census Bureau and Department of Housing and Urban Development's "seasonal adjustment" of the data.
From each company's annual reports and quarterly financial statements, we extract three essential warranty expense metrics: the amount of claims paid, the amount of accruals made, and the balance in their warranty reserve funds at the end of each quarter.
We also collect data on two additional sales metrics: the number of new homes sold, and the revenue raised from those new home sales (not including mortgage or financing revenue, and not including sales of land alone; only the product to which the warranty is attached). And by comparing these sales metrics to the warranty accrual data, we were able to calculate two additional warranty metrics: the percentage of revenue set aside as warranty accruals (the accrual rate), and the average dollar amount of accruals made per home sold (total accruals / number of homes closed).
Since our last warranty report on the new home builders, we've gained three new quarters of data: the fourth quarter of 2022, and the first two quarters of 2023. During 4Q 2022, warranty claims totals hit a collective all-time high for the industry, and accruals hit their second-highest total, only surpassed by the fourth quarter of 2005. Warranty reserves reached a collective high at the end of the most recent completed quarter, 2Q 2023.
Warranty Claims Totals
Figure 1 shows the collective warranty claims totals for all of the U.S.-based new home builders we track, for every quarter since the beginning of 2003. We can see that claims payments are higher than ever before among the publicly traded companies in the industry, even higher than the height of the housing bubble back before the Great Recession.
After a brief dip in claims payments at the onset of the pandemic in 2020, warranty claims have been back on the rise, continuing the trend we've seen for almost a decade at this point. But whereas the growth was slow, gradual, and cautious in the wake of that fateful and dramatic collapse in 2008, it's been more rapid lately.
Figure 1
Homebuilding Warranties
Claims Paid per Quarter by U.S.-based Builders
(in millions of U.S. dollars, 2003-2023)
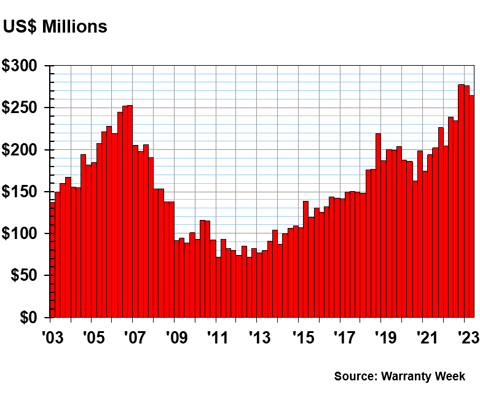
In the most recent completed quarter, the second quarter of 2023, warranty claims totaled $264 million for the companies we track in this industry, an 11% increase year-over-year from the second quarter of 2022.
Year-over-year, the first quarter of 2023 saw an even more dramatic 35% increase in the claims total, compared to the beginning of 2022.
Before last year, the highest claims total we'd seen between the U.S.-based homebuilders was $253 million, recorded in the fourth quarter of 2006, soon before the housing bubble burst. This total was surpassed in the fourth quarter of 2022, at $277 million. Claims totals for the industry have stayed high since then, with the first two quarters of 2023 both also surpassing that old record from 2006.
The u-shaped chart pattern is even more visible in Figure 2, which shows total quarterly accruals for the industry over the same period.
Warranty Accrual Totals
There's a definite seasonal pattern to the warranty accrual data shown in Figure 2. Every year, the first quarter, the winter, is always the slowest, and the fourth quarter, the autumn and "holiday season," is always the busiest. Since accruals are made directly after each sale (at least, they should be, in theory), the growth in Figure 2 is a little less steady, but we can still see the clear upward trend of accrual totals in the past few years.
Figure 2
Homebuilding Warranties
Accruals Made per Quarter by U.S.-based Builders
(in millions of U.S. dollars, 2003-2023)
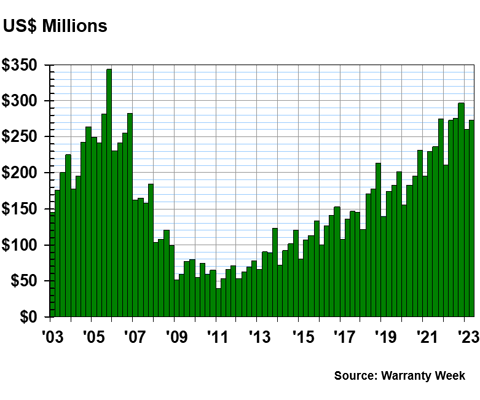
Right now, total accruals are at just about the same level we saw at the ends of both 2006 and 2007.
Accruals among the homebuilders that publish their warranty data totaled $273 million during the second quarter of 2023. That's just about the same total we saw in the second quarter of 2022, meaning there was very little year-over-year growth in warranty accruals. This is likely a result of the U.S. Federal Reserve's several interest rate hikes in the spring of 2023.
In the second quarter of 2023, new home closings for the builders we follow were up by 1%, or about 1,000 homes, to 79,000, compared to the second quarter of 2022.
It's interesting that total unit sales actually increased from the second quarter of 2022 to the same quarter in 2023. So total accruals stayed the same, but more homes were sold, meaning that the homebuilders just ended up accruing a little less money per home. This result is a little surprising, considering U.S. dollar inflation has driven up the cost of parts and repairs, as well as the actual cost of the homes themselves.
Especially since we saw in Figure 1 that the homebuilders have been spending more than ever before on warranty claims, this is an intriguing finding.
In contrast, accruals during the first quarter of 2023 were up by 23% compared to the first quarter of 2022, to a total of $260 million. So we saw big growth in the winter of 2023 compared to the winter of 2022. We will see if the seasonal pattern persists for the second half of 2023, in spite of high interest rates.
Warranty Reserve Balances
In Figure 3, we are tracking the cumulative balance in the warranty reserve funds of the homebuilders we track at the end of each quarter. Despite claims rising faster than accruals recently, reserve balances have continued to climb.
Figure 3
Homebuilding Warranties
Reserves Held per Quarter by U.S.-based Builders
(in millions of U.S. dollars, 2003-2023)
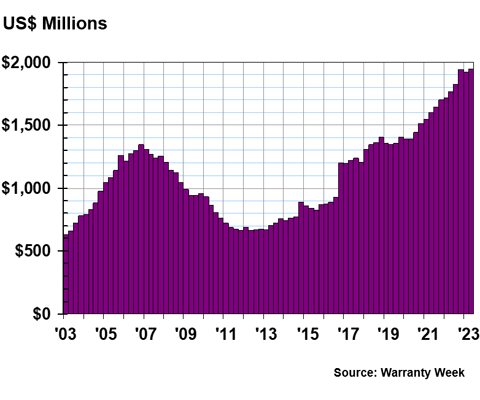
By June 30, 2023, the end of the second quarter, the reserve balance had risen to $1.946 billion, yet another new record. With the exception of the first quarter of 2023, every quarter since the third quarter of 2020 has set a new record warranty reserve balance.
Compared to the end of June 2022, the mid-year reserve balance this year is up 10%. The end-of-quarter reserve balance has risen year-over-year by somewhere between 10%-15% every quarter since that third quarter of 2020.
Warranty Accrual Rates
The warranty-issuing, publicly-reporting homebuilders do a great job of detailing not just the amounts they spend on warranty expenses, but also their unit sales figures. This means that we can divide the total warranty accruals detailed in Figure 2 by two additional sales metrics: total revenue from new home sales, and the total number of units sold. The results of these calculations are the accrual rate, a percentage, and the accrual rate per home, in U.S. dollars, respectively.
Figure 4
Homebuilding Warranties
Average Warranty Accrual Rates
($ per home and % of revenue, 2003-2023)
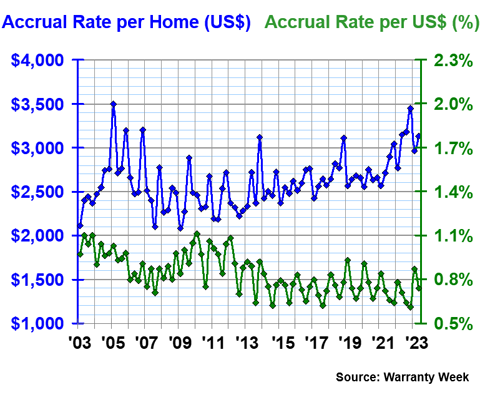
In the second quarter of 2023, the average accrual rate per U.S. dollar of revenue was 0.74%. Over the past 10 quarters, the accrual rate ranged from 0.87% on the high side, recorded recently in the first quarter of 2023, and 0.61% on the low side, recorded during the fourth quarter of 2022.
As we see in Figure 4, on average, the homebuilders put aside more money per new home sale during 2022 than they usually did in the past decade.
The accrual rate per home sold increases or decreases inversely to the accrual rate per U.S. dollar. In the second quarter of 2023, the new home builders put aside an average $3,126 in accruals for each unit they sold. In the last 10 quarters, accruals per new home sale ranged from $2,566 on the low side, from the first quarter of 2021, to $3,445 on the high side, from the fourth quarter of 2022.
Over the past 82 quarters, the accrual rate per dollar of new home sales revenue averages out to 0.84%, with a standard deviation of 0.13%. The accrual rate per home sold over the same period averages out to $2,613, with a standard deviation of $295.
Considering how erratic the quarterly accruals of some of the new home builders detailed in Figures 5-9 are, it's amazing that these standard deviations have remained relatively low, and that these averages, especially the accrual rate per sales revenue, have been so steady, except for the seasonal pattern of the data.
Annual Rates for Specific Builders
In the next five charts, we will detail the accrual rates per home sold for 20 of the builders we track. These metrics correspond to the blue line in Figure 4, and the following charts will reveal why accruals per unit have been on the rise since 2021. In short, the consistency of some of these companies is cancelled out by the sheer erraticism of some of the others.
Figure 5
Homebuilding Warranties
Warranty Accruals Made per Unit Sold
(in U.S. dollars, 2003-2023)
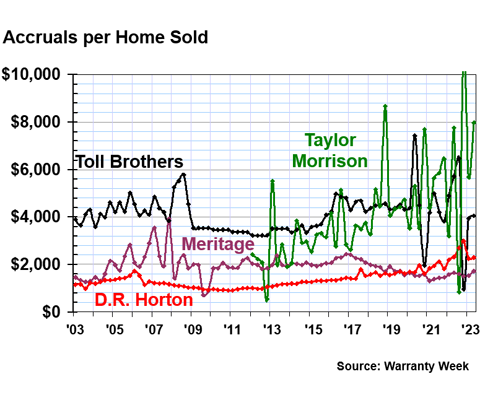
Taylor Morrison Home Corp.'s accruals per home sold were actually so high during the fourth quarter of 2022 that they broke the scale of Figure 5. The company put aside $10,989 for each new home it sold during that quarter. The next quarter, the first of 2023, they halved accruals per unit, and put aside $5,686 per home sale.
In case you're wondering why Taylor Morrison accrued such a huge amount per home at the end of 2022, it's because the quarter before, the third of 2022, they seemingly forgot to put aside any money at all for future warranty costs. The company accrued just $824 per unit in the third quarter of last year.
Just in case anyone from Taylor Morrison is reading this newsletter, we averaged together all of the quarterly accruals per home since they started reporting in 2012, and found that the company has accrued an average of $4,126 per quarter. If they're looking for a place to start mastering their warranty expenses, accruing a consistent amount for every new home sold is a very good place to start.
Of course, we acknowledge that Taylor Morrison's new homes are at the more luxurious end of the market. But so is Toll Brothers Inc., which, until recently, was doing a great job of consistently making warranty accruals per home sold. It's a little hard to see the black line behind Taylor Morrison's green seismograph, but Toll Brothers also dropped accruals significantly at the end of 2022, to just $963 per home, after two quarters of accruals per home a little higher than usual, around $6,000. The company typically accrues about $4,000 per home, and has met that benchmark quite closely in the first and second quarters of 2023.
In contrast, Meritage Homes Corp. and D.R. Horton inc. are very impressive in their persistence and consistency in their warranty accruals per unit sale. The accruals of D.R. Horton, the industry's largest builder, have been rising a bit in the past two years. Each company averages around $2,000 accrued per home; we commend the two for their consistency in their warranty accounting.
Figure 6 shows the next four companies. They've all been consistent in the short-term, but a little all over the place over the past two decades.
Figure 6
Homebuilding Warranties
Warranty Accruals Made per Unit Sold
(in U.S. dollars, 2003-2023)
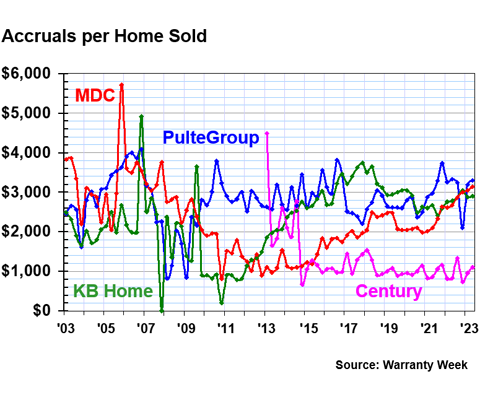
PulteGroup Inc., KB Home, and M.D.C. Holdings all had accruals per new home sale at just around the industry average of $3,216 during the second quarter of 2023. Pulte accrued $3,301 per unit, M.D.C. accrued $3,137 per unit, and KB accrued $2,906.
On the other hand, Century Communities Inc. accrued just $1,106 per unit sale. The company's accruals per new home sold have stayed close to $1,000 most of the time since 2015, not long after the company started reporting.
Figure 7 contains three companies that, for a spell, were accruing so much money per unit that they far exceeded the scale of any of the other company charts. They are great examples of why the method of making almost no accruals for a while, and then one huge accrual when the warranty reserve fund runs out of money, is not the greatest accounting strategy (especially when people like us notice). And these companies seem to have learned that lesson, one way or another.
Figure 7
Homebuilding Warranties
Warranty Accruals Made per Unit Sold
(in U.S. dollars, 2003-2023)
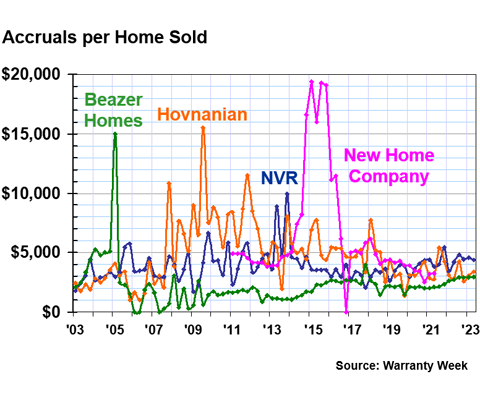
Beazer Homes USA Inc. and Hovnanian Enterprises Inc. both had their spikes in accruals years ago, and their lines have smoothed out since then. Beazer's line has been especially impressively consistent since 2010. During the second quarter of 2023, Beazer accrued $2,953 per home sale, and Hovnanian accrued $3,391, both just around the industry average.
NVR Inc.'s spike wasn't nearly as dramatic, though more recent than the other two. Since 2013, NVR has really smoothed out its line, though its accruals average around $4,500 per unit, higher than the industry average.
The New Home Co. Inc. learned the same lesson that Beazer, Hovnanian, and NVR realized, but it seemed to have come too late. During 2015, the company accrued a shocking average of $19,000 per unit. Accruals dropped to zero at the end of 2016, presumably after they realized they had a large amount of excess funds in the warranty reserve. Things became a little more consistent after that, but it was a sign. The company was officially acquired by Apollo Global Management during September 2021, and stopped trading publicly, thus ceasing its financial reporting as well.
We see this pattern again with Shea Homes LP and William Lyon Homes in Figure 8. In contrast, Figure 8 also depicts two of the most consistent in their accruals, M/I Homes Inc. and LGI Homes Inc.
Figure 8
Homebuilding Warranties
Warranty Accruals Made per Unit Sold
(in U.S. dollars, 2003-2023)
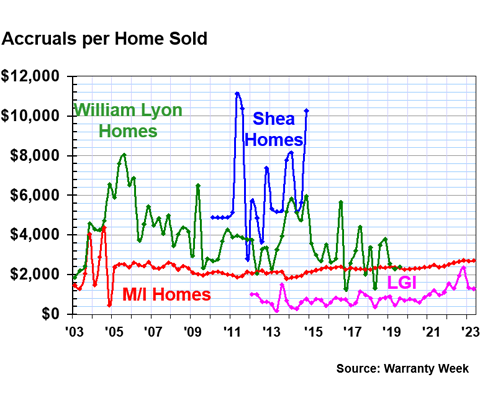
Shea Homes only reported for a few years, from the beginning of 2010 until the end of 2014. In that five-year period, the company accrued $2,790 per home at the lowest, and $11,103 per home at the highest. Those two figures were actually both reported during 2011. Apparently, the company got injected with enough private venture capital a decade ago that the company stopped publicly trading and reporting.
William Lyon was not as volatile as Shea Homes, but clearly not nearly as consistent as LGI or M/I Homes either. The company was acquired by none other than Taylor Morrison at the end of 2019.
We did a little math in order to give out official accolades to the best warranty accounting among the new home builders we track. Based on standard deviations over the past 82 quarters, LGI Homes and D.R. Horton are tied for the title of least volatile accruals per unit sale. In second place is M/I Homes, and Meritage takes the bronze.
Figure 9 is basically the family tree of the one of the four still in business, Lennar Corp. Standard Pacific Homes and the Ryland Group Inc. merged in 2015 and changed their name to CalAtlantic Group. And then in early 2018, Lennar Corp. acquired CalAtlantic.
Figure 9
Homebuilding Warranties
Warranty Accruals Made per Unit Sold
(in U.S. dollars, 2003-2023)
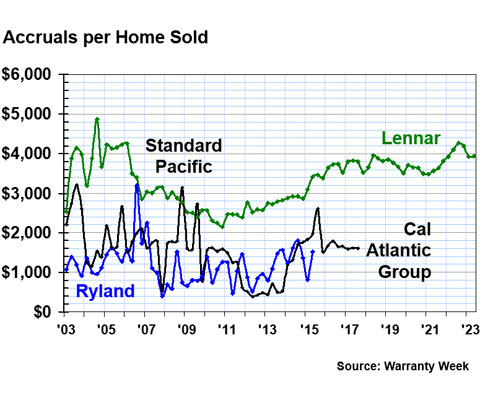
Lennar accrued $3,937 per unit during the second quarter of 2022, a little higher than the industry average, and considerably higher than their largest direct competitor, D.R. Horton. D.R. Horton and Lennar are the largest and second-largest homebuilders in the U.S., respectively.
Especially impressive is Lennar's continued relative consistency in warranty accounting, considering the volatility of the companies it acquired that are shown in this chart. Lennar and D.R. Horton are great examples of how far a good warranty department can get you in the industry. Inevitably, elements of new homes break while still under product warranty. What the homebuilder does next can make or break its business, as we've seen in this report.

We are pleased to share the news that the MAPconnected Vehicle Service & Warranty Lifecycle Summit, October 24 - 25, 2023 to be held at the Henry Autograph Hotel, Dearborn, MI has officially become the must-attend gathering for Motor Vehicle executives responsible for the design and execution of Warranty, Recall, Aftersales, Technical Services, Customer Care and Aftercare Support Services.
Take advantage of the Early Bird Ticket Discounts by registering your ticket at www.mapconnected.com prior to Friday, September 15th, and benefit from true-peer benchmarking and networking amongst senior leaders from Automotive, Powersport, Bus, Truck, Construction and Agricultural OEMs, Parts and Equipment Suppliers, their Retailers, Dealers, Distributors, Logistics and Services Providers.
2 FULL DAYS | 50 SPEAKERS | 7 TRACKS | 8 NETWORKING HOURS | TECH EXPO
Download our newly launched Brochure to find the latest agenda and speaker line-up.
Featured Keynote:
- Frederiek Toney, President, Global Ford Customer Service Division (2009-2022) - Ford Motor Company
Confirmed Case Study Speakers:
- Jennifer Neuman, Assistant General Counsel - American Axle & Manufacturing
- Ed Roberts, Chief Operations Officer - Bozard Ford Lincoln
- Kristine Binkley, Customer Care & Aftersales Data Manager - BraunAbility
- James Kiriazes, Director, Customer Quality Engineering - Bridgestone Americas
- Helen Riehle, Recall and Technical Campaign Manager - BMW of North America
- Tony Smith, Director Service Engineering - Canoo
- Jim Knight, Director, Global Warranty Quality - Cummins
- Michael Cavaretta, Analytics Executive Manufacturing - Ford Motor Company
- Jennifer Jones, Global Lifetime Warranty Manager - Ford Motor Company
- Jose Clemente, Warranty Performance Manager - General Motors
- James Jensen, National Warranty Manager - Kenworth Truck
- Bryan Tracy, Senior Manager Supplier Warranty - Navistar
- Paul Rogers, Senior Manager Warranty - Nissan Group of North America
- Hallie Spetnagel, Warranty Manager - Peterbilt A Paccar Company
- Casandra Tessitore, North America Warranty Manager - Sensata Technologies
- Brad Klein, Senior Manager Warranty Operations - Toyota North America
- Terry Busch, Chief Data Officer - U.S. Defense Intelligence Agency (1997-2020)
- Julie Johnson, Head of Market Development & Growth Strategy NA - Volta Trucks
Key Summit Pillars: Quality & Supplier Management | Connected Customer Care & Recall | Dealer Technical Services & Field Ops | Warranty Admin: Legal / Regulatory Compliance | Telematics & Analytics Data Sharing/ Utilization | EV Servicing & Products | Financial Products & Extended Services
Testimonial: "Great conference, tremendous takeaways and learnings regarding what my direct peers are doing." Volvo & Mack Trucks – Warranty Program Manager & 3pp team!
Here’s some highlights you can expect from our 2023 agenda:
- Debugging AI & PREDICTIVE ANALYTICS: Dedicated Financial & Quality Tracks
- Using warranty data for improved administration, QUALITY AND SUPPLIER MANAGEMENT and ROOT CAUSE ANALYSIS
- Best practices on advanced uses of TELEMATICS data
- Advanced WARRANTY EDITS - what works, what doesn't?
- The LEGAL & REGULATORY world continues to evolve. What's the latest and next?
- TECHNICIAN: TOOLS AND DIAGNOSTICS, training, hiring and retention
- Staying connected with the customer, OVER-THE-AIR-UPDATES, and input from NHTSA related to field service actions
- Informative case studies on successful WARRANTY IMPROVEMENT INITIATIVES
Don’t miss the Early Bird Ticket Discount Offers available through September 15th for MAPconnected’s powerful gathering that is uniting the Warranty & Aftercare Value Chain and provides an exclusive opportunity to exchange easily implementable ideas guaranteed to optimize costs, enhance customer satisfaction and ensure continuous Warranty Lifecycle Roadmap improvement.
Register here @ www.mapconnected.com or Click here to sign up for summit speaker and agenda announcements.
Event Contact Pam Walter, pwalter@mapconnected.com