
Nine-Month New Home Warranty Update:
Warranty expenses are at a new peak for the new home builders, for the first time since the housing bubble crash. But new homes are quite costly these days, and so are their repairs under product warranty.
As the year comes to an end, we wanted to take a look at the third quarter warranty data for the U.S.-based new home builders. As we all contemplate what 2024 may hold in store for us—and for the world of warranties—we're taking a look at an industry that is considered a leading economic indicator.
Some claim that we're currently in a recession, some claim that there was a recession and it's over, and others say that the next recession is imminent. Is an economy similar to a broken arm, to which the adage "if it was broken, you'd know it" applies? Or is it possible to be embroiled in a recession at a time where a majority of major global corporations are making more money and spending more on warranty expenses than ever before?
When Lehman Brothers declared bankruptcy in September 2008, we knew that we were in a recession, and the worst was yet to come. But looking back, the signs were there as early as the beginning of 2007. In December 2008, the National Bureau of Economic Research declared that the peak was in December 2007, and the decline began thereafter. But how many of us were aware that we were entering a recession at this time of year in 2007?
Especially with the new home builders, we can look back at the 20-year historical data and see the top of the housing bubble, and its precipitous decline in the Great Recession. The industry's warranty spending peaked in 2006, with a sharp decline in 2007, and a fall off a cliff in 2008 and 2009. The recovery was much more gradual than the drop, and warranty claims and accruals only reached 2006's levels again in 2022 and 2023.
The big question, then, is: What does it mean that the new homebuilders are once again spending the same amounts on warranty expenses as they did before the last huge recession? Well, perhaps not much, considering high U.S. dollar inflation from the late 2000s to 2023. Just for fun, we used the U.S. Bureau of Labor Statistics' Consumer Price Index Inflation Calculator to see what our highest recorded warranty accrual total for the homebuilders, $344 million in the fourth quarter of 2005, would very roughly be worth in 2023, adjusted for inflation. The 2023 "equivalent," so to speak, of that 2005 total is $625 million. In that context, this year's highs aren't nearly where they were at that last peak, in terms of value.
Still, it's a weird market right now. Everything costs more, but people still seem to be buying things. New homes are no exception. 30-year mortgage rates in the United States are averaging about 7% right now, but people are still buying new homes anyway, and more housing developments keep getting built. And don't forget that the median sales price of a new home sold in the United States peaked in October of 2022 at almost $500,000, after rising steeply from about $300,000 at the start of the pandemic, according to the U.S. Federal Reserve.
So maybe we're not totally convinced by the doom and gloom pundits on CNBC, claiming that the recession is here and we just don't know it. Surely, inflation is here, but economic activity doesn't seem to have lulled in anywhere near the same way we saw back in the late 2000s.
Still, let's let the warranty data speak for itself. Since 2003, we have collected warranty expense data from all of the publicly-traded new home builders based in the United States. These 58 homebuilders account for approximately one-third of new residential construction in the United States, and include a variety of homes, many pre-fabricated, ranging from mobile homes to McMansions.
From each company's annual and quarterly financial statements, we extracted three key warranty metrics: the amount of claims paid, the amount of accruals made, and the end-balance in the warranty reserve fund. We also collected data on two additional sales metrics: the number of new homes sold, and the revenue raised from those home sales, not including financing or mortgage revenue, nor revenue from sales of land alone. By comparing these sales metrics with the warranty accrual data, we calculated two additional warranty metrics: the percentage of revenue set aside as warranty accruals (the accrual rate), and the average dollar amount of accruals made per home sold.
First, we'll take a look at the industry-wide totals for the three warranty metrics, and then we'll delve into the accruals per home sold of top publicly-trading homebuilders.
Warranty Claims Totals
Figure 1 shows the collective quarterly warranty claims totals for all of the U.S.-based homebuilders we track, from 2003 to the third quarter of 2023.
Figure 1
Homebuilding Warranties
Claims Paid per Quarter by U.S.-based Builders
(in millions of U.S. dollars, 2003-2023)
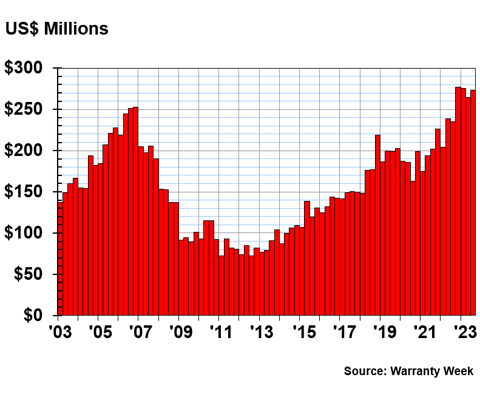
The homebuilders we track spent a total of $273 million on warranty claims in the third quarter of 2023, up 16% compared to the third quarter of 2022.
In the first nine months of 2023, the homebuilders spent a total of $813 million on warranty claims. This is a $136 million, or 20%, increase compared to the claims total during the same period of 2022.
Among those who saw their claims payments rise the most in the first nine months of 2023, compared to the same period of 2022, are: Cavco Industries Inc., Taylor Morrison Home Corp., KB Home, Meritage Homes Corp., Hovnanian Enterprises Inc., and M.D.C. Holdings Inc.
Very few of the companies we track saw their claims payments decrease from the first nine months of 2022 to the first nine months of 2023. In fact, there were only two homebuilders that paid less in claims in 2023 than they did in 2022: LGI Homes Inc., and Beazer Homes USA Inc.
Warranty Accrual Totals
Figure 2 shows the collective quarterly warranty accruals made by all of the homebuilders we're tracking, from 2003 to the third quarter of 2023.
Figure 2
Homebuilding Warranties
Accruals Made per Quarter by U.S.-based Builders
(in millions of U.S. dollars, 2003-2023)
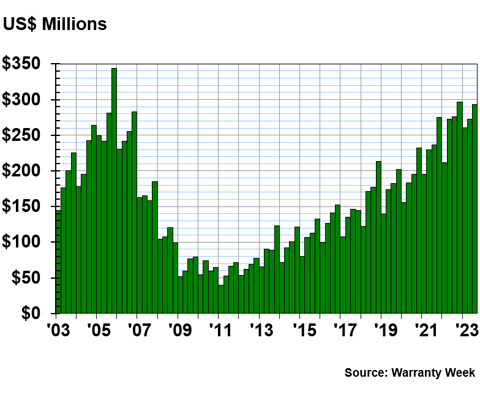
The homebuilders accrued a collective $293 million during the third quarter of 2023, up 6% compared to the same quarter in 2022. In the first nine months of 2023, the homebuilders accrued a total of $827 million, up $67 million, or 9%, compared to the first nine months of 2022.
Comparing the first nine months of 2022 to the first nine months of 2023, these companies had the largest increases in their total warranty accruals: Taylor Morrison, Cavco Industries, and Green Brick Partners Inc. And the companies that decreased their accruals the most between those two nine-month periods are: Beazer Homes, Hovnanian Enterprises, Toll Brothers Inc., LGI Homes, and Century Communities Inc.
Warranty Reserve Totals
In Figure 3, we're looking at the closing balance in the homebuilders' warranty reserve funds at the end of each quarter, from 2003 to the third quarter of 2023.
Figure 3
Homebuilding Warranties
Reserves Held per Quarter by U.S.-based Builders
(in millions of U.S. dollars, 2003-2023)
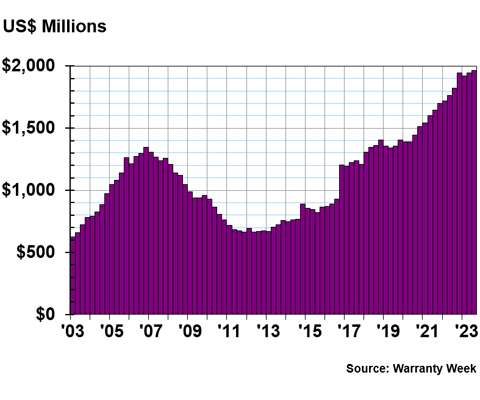
The homebuilders we track reached another record high in their collective warranty reserve balance. At the end of the third quarter of 2023, the new home builders held a total of $1.97 billion in warranty reserve funds.
Compared to the first nine months of 2022, the first three quarters of 2023 saw reserve balances rise by 8%, or an additional $142 million deposited into warranty reserves.
Warranty Accrual Rates
The publicly-reporting, warranty-issuing new home builders do a great job of detailing not just how much they spend on warranty costs, but also their unit sales figures. This means that we can put the accrual figures in the denominator, and the unit sales figures in the numerator, to create two helpful ratios for analyzing these data: the accrual rate, a percentage (accruals/revenue), and the accrual rate per home, in U.S. dollars (accruals/number of homes sold). Figure 4 shows these two metrics over the past 20 years.
Figure 4
Homebuilding Warranties
Average Warranty Accrual Rates
($ per home and % of revenue, 2003-2023)
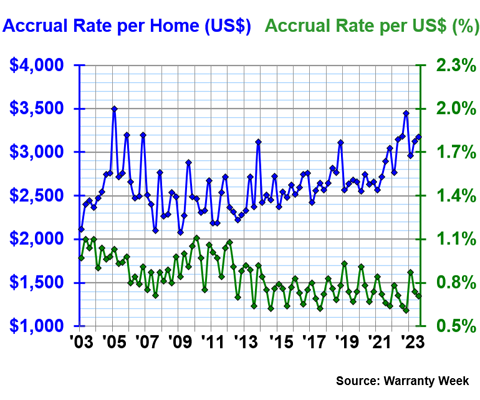
In the third quarter of 2023, the average accrual rate per U.S. dollar of sales revenue was 0.71%. This is a little higher than the same rate during the third quarter of 2022.
We can see that there's a seasonal pattern to accruals in this industry, reflecting a seasonal sales pattern for new homes. Accruals in this industry tend to fluctuate from quarter to quarter, with consistency definitely not the norm in warranty accounting practices.
The accrual rate per home sold (dollar amount) increases or decreases inversely to the accrual rate per U.S. dollar (percentage). In the third quarter of 2023, the homebuilders put aside an average of $3,177 in warranty accruals for each new home they sold, down -0.1%, or -$2.48, compared to the third quarter of 2022.
The data in Figure 4 look a little chaotic, but compared to the individual accrual rate data for some of the largest homebuilders we track, these data are actually rather smooth and consistent. Figure 4 presents quarterly averages of data from 58 different manufacturers (keep in mind that only 19 of those 58 are currently in business and reporting). In Figures 5-9, we'll look specifically at the accrual rates of the largest homebuilders we track.
Accrual Rates for Specific Builders
The quarterly accrual rate charts for some of the following companies look like EKGs, while others look like straight lines or small, gradual hills. We'll explore the diversity in warranty data for the U.S.-based new home builders currently in business and publicly reporting.
Figure 5
Homebuilding Warranties
Warranty Accruals Made per Unit Sold
(in U.S. dollars, 2003-2023)
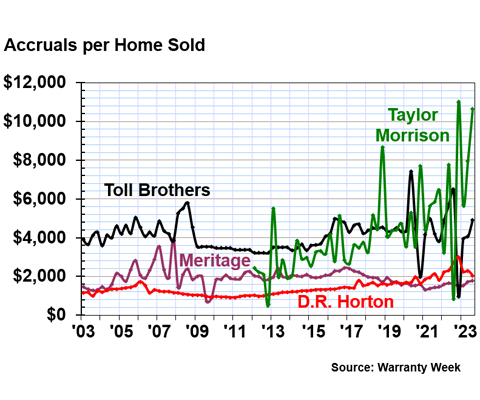
Our first four companies are Taylor Morrison Home Corp., Toll Brothers Inc., Meritage Homes Corp., and D.R. Horton Inc.
Taylor Morrison builds higher-end new homes, mainly in the South, southwest, and West Coast. The company's accruals per home were so high in in the fourth quarter of 2022 and the third quarter of 2023 that we needed to change the scale of Figure 4 to fit the high outliers. In the third quarter, Taylor Morrison accrued a whopping average of $10,639 per new home sold. We hope for their sake that they're not really paying that much in warranty claims for each home they manufacture.
There is a possibility that Taylor Morrison has an accounting habit of making almost no accruals in one quarter, and then making up for that in following quarters. Case in point, Taylor Morrison accrued only $824 per unit in the third quarter of last year, so the year-over-year percent increase for this metric is nearly 1,200%. It's a little ridiculous, but it's not completely out of the norm for this company.
Toll Brothers builds luxury homes, including luxury living complexes for seniors and other gated communities. The company accrued an average of $4,911 per home in the third quarter of 2023. Still, high, but not unreasonable, and a good correction back to consistency after erratic warranty accruals in 2022.
Meritage, similar to the other two, builds single family homes and gated communities. But in contrast, Meritage accrued an average of $1,771 per unit sold in the third quarter of 2023. This is up slightly, but a continuation of Meritage's streak of over a decade of very consistent warranty accruals.
D.R. Horton makes the same types of homes, and is the largest of the homebuilders that we track. Its streak of consistency has unfortunately been disrupted in the past few years, after a remarkable decade of warranty accounting. Maybe someone in the department retired. D.R. Horton accrued an average of $2,035 per unit during the third quarter of 2023.
The next four companies are in the mid-range of average accruals per home sold.
Figure 6
Homebuilding Warranties
Warranty Accruals Made per Unit Sold
(in U.S. dollars, 2003-2023)
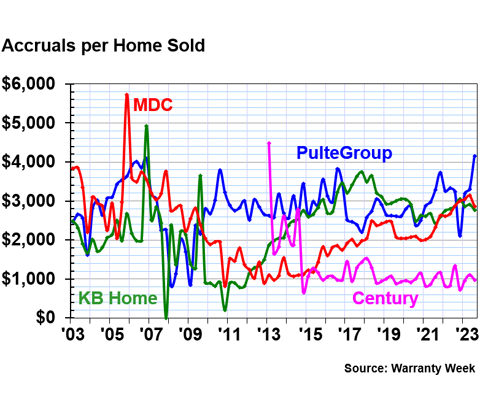
Figure 6 shows the average quarterly warranty accruals per unit sold for four more U.S. homebuilders: PulteGroup Inc., KB Home, M.D.C. Holdings Inc., and Century Communities Inc. All four build the types of homes you'd expect to see in a suburban housing development anywhere in the country.
In the third quarter of 2023, PulteGroup accrued an average of $4,157 per home sold. This was a high outlier for the company, after a low outlier during the fourth quarter of 2022.
KB Home averaged a more moderate and reasonable $2,772 per home sold during the third quarter of 2023. Right there with them, M.D.C. Holdings accrued an average of $2,860 per home.
On the lower side, Century Communities accrued an average of just $971 per home sold. The company tends to keep its quarterly average within a few hundred dollars of the $1,000 benchmark, though we see a good deal of variation from quarter to quarter.
Figure 7 shows the average accruals per unit for our next batch of four homebuilders.
Figure 7
Homebuilding Warranties
Warranty Accruals Made per Unit Sold
(in U.S. dollars, 2003-2023)
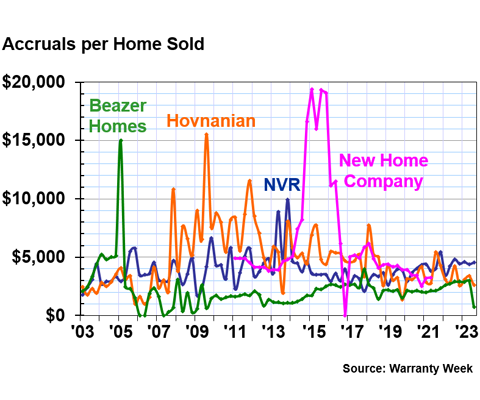
Figure 7 shows the accrual rates for four homebuilders that used to be very volatile, but have smoothed out the oscillations in their warranty accounting: Beazer Homes USA Inc., Hovnanian Enterprises Inc., NVR Inc., and New Home Co. Inc., which was acquired in 2021. All four make similar styles of home, single-family units and townhomes destined for the suburbs.
Beazer had a huge blip back in 2005, when it accrued an average of nearly $15,000 per home in a single quarter. Since then, the company has smoothed out its line a lot and started accruing a consistent amount per home sold. With that said, the company's accrual rate dropped in the third quarter of 2023 to just $721, about a third of what the average typically is.
Hovnanian had trouble with its warranty accounting from 2008 to 2012, with a particularly costly quarter in 2009. The company's line still oscillates a good deal, though we've seen more consistency from the company in the last few years. The company averaged $2,589 in accruals per home sold during the third quarter of 2023.
NVR accrued an average of $4,549 per home in the third quarter of 2023, the highest of the bunch. The company is also fairly consistent in its numbers now, after years of tumult in the warranty department.
New Home Co. is a great example of why this metric matters. The company accrued nearly $20,000 per home for four quarters back in 2015, not too long after it started publicly reporting. The line was smoothed later on, but the costs proved too dear to recover from, and they were acquired by the private equity firm Apollo Global Management during the pandemic. This is despite home prices soaring right around the same time. Think of the pink line in Figure 7 as a cautionary tale.
Our next group of four companies includes two more that were acquired after some financial trouble, including high warranty costs.
Figure 8
Homebuilding Warranties
Warranty Accruals Made per Unit Sold
(in U.S. dollars, 2003-2023)
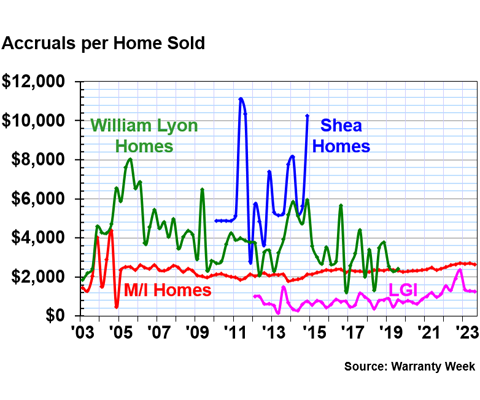
Figure 8 shows the average accruals per home sold for M/I Homes Inc., LGI Homes Inc., Shea Homes LP, and William Lyon Homes. Shea Homes was acquired by a private investor back in 2014, and William Lyon was acquired by Taylor Morrison at the end of 2019.
LGI and M/I are the two least volatile companies in this whole report. M/I has been especially consistent in recent years, while LGI has seen some slightly larger variations in quarterly averages. In the third quarter of 2023, M/I accrued an average of $2,646 per home sold, and LGI accrued an average of $1,268 per home sold.
Our final chart, Figure 9, is basically the family tree of Lennar Corp., the only one of the four companies still in business. Standard Pacific Homes and the Ryland Group Inc. merged in 2015 and changed their name to CalAtlantic Group. And then in early 2018, Lennar Corp. acquired CalAtlantic.
Figure 9
Homebuilding Warranties
Warranty Accruals Made per Unit Sold
(in U.S. dollars, 2003-2023)
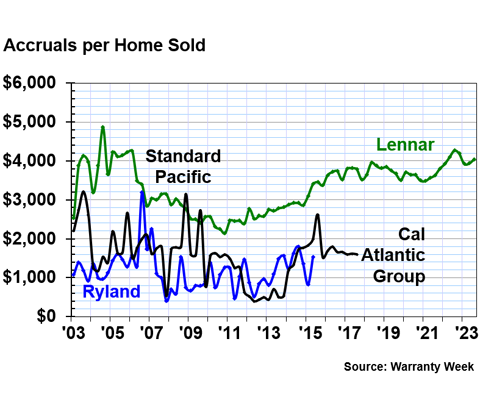
Lennar accrued an average of $4,042 per home sold during the third quarter of 2023. That's a little on the high side compared to the other companies in this report, and higher than the average accrual rate of any of Lennar's three business acquisitions depicted in this chart. Notice that this rate started to fluctuate and increase more after these mergers and acquisitions took place.
Happy Holidays!
We're sure that this newsletter will receive a few more out-of-office messages than usual, and we sincerely hope you're currently reading this from somewhere you love. We wish all of our readers a very happy winter solstice, and a happy Christmas to all who celebrate. We'll be back next week for a very special year-end edition of Warranty Week!