U.S. Auto OEM & Supplier Warranty Update:
Supplier recovery seems to be more popular with OEMs to boost revenue in times of economic hardship, or in cases of huge, multi-billion dollar recalls. But industry-wide, auto OEMs eat a lot of warranty costs that really should be passed on to their parts suppliers, which only account for about one-tenth of the industry's total warranty spending.
Supplier recovery is a hot-button issue in the U.S. automotive product warranty space, and has especially become an area of concern for many auto OEMs in the wake of revenue challenges from the pandemic. There is a great deal of back-and-forth between OEMs and their suppliers about who should take on warranty costs, especially in the face of the dreaded "no trouble found" designation, where suppliers state that a returned part wasn't faulty, and thus they're not liable for the cost.
Of course, in a perfect world, whichever manufacturer in the supply chain was found to be responsible for the failure of a new vehicle would pay their "fair share" of the warranty costs associated with its repair or replacement. But the real world is far from perfect, and this can become messy in practice. Often, it's a process of deferring and conferring blame from one party to another. The OEM says their Tier 1 supplier gave them a faulty part. The Tier 1 supplier says that there was no issue with their part, but perhaps the OEM installed it in the vehicle incorrectly. Or perhaps the Tier 1 supplier will own up to the issue, but in turn determine that they were provided a faulty component from one of their Tier 2 suppliers. And the process goes on, with a lot of back-and-forth and inefficiency.
Costs can be recovered eventually, but the OEM has to front the money for the repair in the meantime. Consumers don't care who is at fault, just that the repair is made as soon as possible. Then the OEM is playing catch-up, deciding whether the potential cost recovery is worth the process of investigating the issue, and requesting reimbursement for the repair from the supplier that provided the faulty part.
We've seen some high-profile supplier recovery stories in the U.S. automotive manufacturing sector in recent years. The biggest story that comes to mind is the General Motors Chevy Bolt battery recall, which we most recently covered in detail in our November 2, 2023 newsletter. The recall cost GM roughly $3 billion back in 2021. As recently as the third quarter of 2023, GM announced a further $800 million in supplier recoveries from that recall—in addition to the $1.9 billion they had already recovered prior.
In that case, it obviously was worthwhile to pursue recovery of those warranty costs from the suppliers that provided the faulty battery components. But in smaller cases—perhaps just a handful of failures, up to a few hundred—OEMs do not always pursue recovery, though it is becoming more common. And this process and its pathways vary also between the manufacturers of passenger cars, motorcycles, and other small vehicles, and the manufacturers of trucks, buses, heavy equipment, and other large vehicles, which have different relationships with their consumers and their suppliers.
In round numbers, we've found that automotive suppliers are paying roughly a tenth of the industry's warranty costs, while their share of sales revenue exceeds a third. So there certainly is a gap between what they're paying and what they "should" pay. We won't attempt to jump to any conclusions about this fraught dimension of automotive product warranty. But we will gladly present the relevant data, for our readers' own interpretation.
Methodology
In this newsletter, we are going to take a look at the total warranty claims paid, accruals made, and reserves held by the U.S.-based auto OEMs, broken up into the categories of Cars & Small Vehicles and Trucks & Large Vehicles, as well as their parts suppliers. We will then look at those totals in proportion to each other, as parts of a whole. We gathered these data on a quarterly basis, by perusing the financial statements of each of the 195 U.S.-based, publicly reporting manufacturers we identified for this report.
Since these are quarterly data, our numbers are as recent as the third quarter of 2023 for all but a handful of the 195 companies. For those that report annually, rather than quarterly, and have fiscal years ending on December 31, we fashioned estimates for the first three quarters of 2023, based on their 2022 data. The 2023 data are estimates for 13 companies in this report, the largest of which are: Eaton Corp. plc, Goodyear Tire & Rubber Co., Illinois Tool Works Inc., and Alamo Group Inc.
The first of our three categories of manufacturers, which we entitled Cars & Small Vehicles, is comprised of 35 OEMs, the largest of which are: Ford Motor Co., General Motors Co., Tesla Inc., Polaris Inc., Toro Co., and Harley-Davidson Inc. The manufacturers in this category make cars, motorcycles, boats, street sweepers, electric bicycles, and other vehicles roughly smaller than a van.
The next category is Trucks & Large Vehicles, which is comprised of 34 OEMs. The largest manufacturers in this group are: Deere & Co., Caterpillar Inc., Paccar Inc., Thor Industries Inc., AGCO Corp., and Winnebago Industries Inc. This group includes makers of on-highway trucks, agricultural equipment, construction equipment, RVs, buses, firetrucks, freight railcars, and other vehicles larger than a van. Note that for all groups, the historical data includes now-defunct companies; e.g., Navistar's data is included until the second quarter of 2021, when the company was acquired by the German Traton SE (formerly Volkswagen Truck & Bus).
Our third category accounts for the most companies, but the smallest proportion of warranty costs by far. The Auto Parts category includes all of the U.S.-based Tier 1, Tier 2, and aftermarket parts suppliers, a total of 126 companies. 62 of that 126 were still actively trading and reporting in 2023, the largest of which are: Cummins Inc., BorgWarner Inc., O'Reilly Automotive Inc., Westinghouse Air Brake Technologies Corp., Eaton Corp. plc, and Standard Motor Products Inc.
Before we get started, we have to acknowledge the limits of the analysis below. The automotive business is global, while this analysis is for a single country. When we look at only U.S.-based manufacturers, we are excluding the output of not only all the Chrysler and Jeep plants (owned by a European parent), as well as the output of all the U.S.-based factories of Volkswagen, BMW, Hyundai, Toyota, and Honda, among others. We are also excluding the American production of important non-American suppliers such as Magna International, Autoliv, Robert Bosch, and others.
And, of course, we have to include all the products made in Europe, Asia, and elsewhere by American companies such as GM and Ford, as well as the exports of dozens more, because each company provides us with only one worldwide set of expense totals for all their products in all their markets. In other words, we are on the one hand excluding quite a bit of U.S.-based production by foreign firms, and on the other hand we are including the foreign sales of U.S.-based manufacturers. And we haven't said anything about all the cross-border activities occurring along the Mexican and Canadian borders.
Warranty Claims Costs
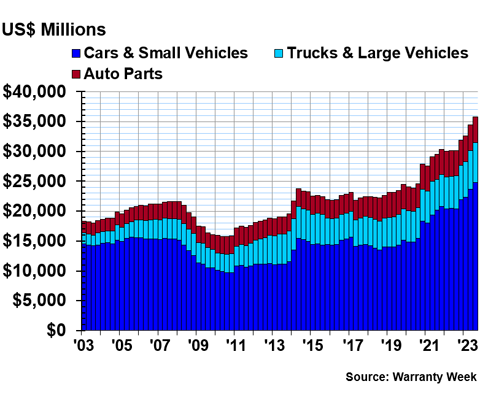
First, we'll take a look at the total warranty claims costs for each of the three groups since 2003, depicted in Figure 1.
Figure 1
Automotive Warranties:
Claims Paid by U.S.-based Manufacturers
(in US$ millions, 2003-2023)
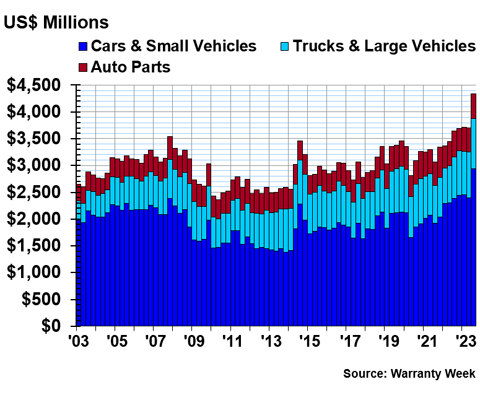
In Figure 1, we can easily spot the recessionary dip of 2009-2013, and a more temporary dip in 2020. And we can see the big recall-related spike of 2014.
At first glance, we can see that of the three categories, the car & small vehicle OEMs have the most variation in their claims totals. The auto parts manufacturers have a fairly consistent bar size, as do the truck & large vehicle manufacturers, though both have seen some gradual growth in their totals, due to U.S. dollar inflation. The bigger fluctuations of the warranty claims costs of the small vehicle OEMs, compared to the other two categories, shows that direct contact with consumers is correlated with less-predictable and more variable warranty costs.
In the most recent quarter, the third quarter of 2023, the car OEMs saw a big jump in their warranty claims payments, a 23% increase from the second quarter of this year. The small vehicle OEMs paid a collective $2.94 billion in warranty claims during the third quarter of this year. In contrast, the large vehicle OEMs paid $929 million in claims during the third quarter, and the auto parts suppliers paid just $468 million.
We can think of the warranty payment system as a zero-sum game, because after the (often lengthy) supplier recovery is complete, only one manufacturer takes on those costs, usually reimbursing the entity that paid for the initial repair. So by knowing the costs taken on by all three groups, we know the total costs within the system. During the third quarter of 2023 alone, the automotive industry paid a total of $4.34 billion in warranty claims. As we can see in Figure 1, this is the highest collective total the industry has ever seen, and the first time U.S.-based auto manufacturers paid more than $4 billion in claims in just one quarter.
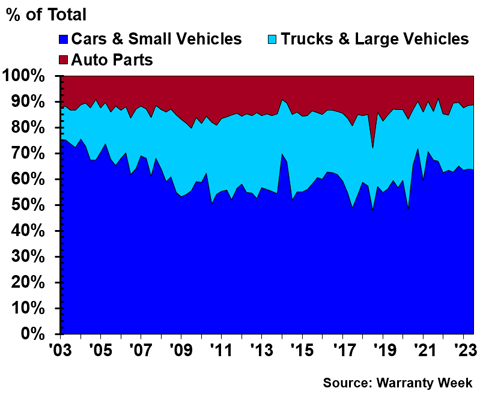
With this frame of thinking, we were curious to see the overall proportions between the three sub-groups within the industry, and how those have changed over the past 20 years. Figure 2 depicts the numbers from Figure 1 in proportion to each other, as parts of a whole.
Figure 2
Automotive Warranties:
Claims Paid by U.S.-based Manufacturers
(as a percentage of 100%, 2003-2023)
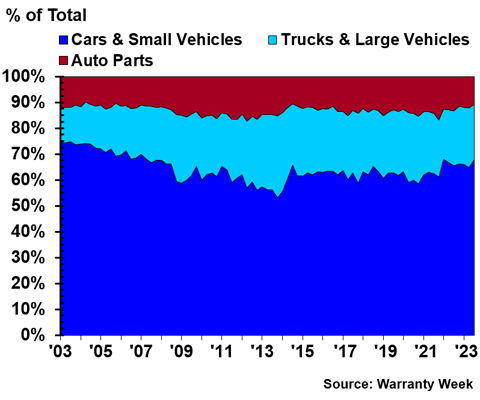
Figure 2 shows that the truck & large vehicle OEMs have actually taken on a larger proportion of the warranty costs in the industry, while the auto parts suppliers have stayed at just a little bit over 10% of the industry's costs.
At the beginning of 2003, the car & small vehicle OEMs paid 75% of the industry's total warranty claims, while truck & large vehicle OEMs paid just 13% of claims, and their auto suppliers paid 12%.
At the beginning of 2013, the car OEMs paid 57% of the industry's claims, while the truck OEMs paid 28%, and the auto parts suppliers paid 15%.
And at the beginning of 2023, the car OEMs paid 66%, truck OEMs paid 22%, and the auto suppliers paid 12%.
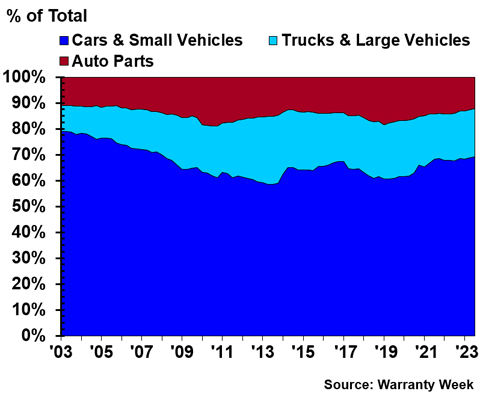
In Figure 3, let's zoom in on the top of Figure 2, to really see the nuances of how these proportions have changed over the years.
Figure 3
Automotive Warranties:
Claims Paid by U.S.-based Manufacturers
(as a percentage of 100%, 2003-2023)
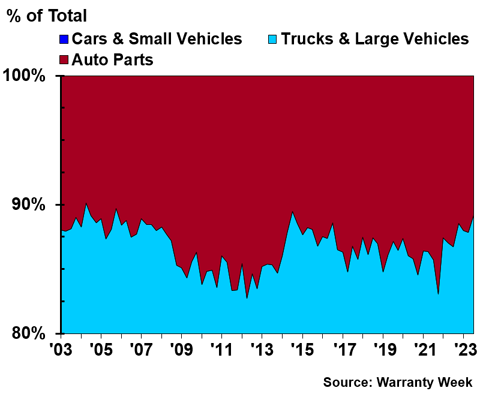
The auto parts suppliers' proportion of the industry's total warranty claims costs peaked in 2011 and 2012, when they accounted for 17%.
Notice that the ratio was consistently high before the recession, consistently low during the recession, and has been both high and low since the 2014 recall-related spike. We would suggest that this documents the increased post-2008 efforts by the OEMs to recover more reimbursements from their suppliers, the setback these efforts suffered after the 2014 recalls, and finally the back-and-forth between the OEMs and suppliers that has occurred since.
The OEMs most recently had a big moment for supplier recovery in late-2021, when the auto parts suppliers' proportion of costs again rose to 17%, though this fell back to 13% in the next quarter.
There's no consensus within the industry about what the "right" ratio is between the warranty expenses of the OEMs and their suppliers. Some say it's 80-20; others say it's 70-30. But we can see that both of these ideal ratios far exceed the reality. The way things are now, suppliers account for about one-third of the revenue, but only one-tenth of the warranty expenses, except in a few special quarters that can be considered "wins" for the OEMs.
There's a lot of factors at play here, and we recognize that OEMs can take on additional costs in a warranty repair beyond the cost of the part replacement, including labor, the cost of loaner vehicles, and even the free cookies at the dealership. But there certainly is a gap between what suppliers pay and what they "should" be paying.
We would urge auto OEMs to recognize that supplier recovery is not just a useful way to boost revenue figures in lean times, and should not just be a strategy reserved for cataclysmic, multi-billion dollar product failures and recalls. But of course, we also recognize the inefficiencies of the system, from no-trouble-founds, to the time, labor, and bandwidth required to pursue reimbursement.
We've emphasized claims costs in this report, since these are the actual costs being recovered in this system. However, we are also going to take a look at the totals and proportions between these three groups in warranty accruals and reserves, to learn a little more about the dynamics between them.
Warranty Accruals
Figure 4 shows the total warranty accruals made by our three groups of manufacturers over the past 20 years.
Figure 4
Automotive Warranties:
Accruals Made by U.S.-based Manufacturers
(in US$ millions, 2003-2023)
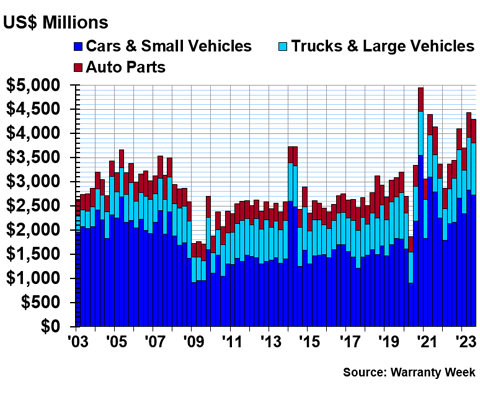
In Figure 4, we can see the Great Recession and the 2014 recalls, and compare those events to the comparative chaos of the past few years in the automotive industry. We have the mid-2020 dip, followed by the huge accruals made by GM due to the EV battery recall. Accruals have been on the rise in the truck & large vehicle sector, but the car & small vehicle sector has had much more fluctuation in its quarterly warranty accruals over the past few years.
In the third quarter of 2023, the car & small vehicle OEMs accrued $2.73 billion, while the truck & large vehicle OEMs accrued $1.08 billion, and the auto parts suppliers accrued $485 million.
Across the whole U.S.-based auto industry, $4.29 billion in warranty accruals were made during the third quarter of this year.
Figure 5 shows the relative proportions of the warranty accruals of these three sectors as parts of a whole.
Figure 5
Automotive Warranties:
Accruals Made by U.S.-based Manufacturers
(as a percentage of 100%, 2003-2023)
We see similar patterns here as we did in Figure 2, where the proportion of truck OEM accruals grew in comparison to car OEM accruals during the Great Recession, but this trend reversed in recent years. Meanwhile, the auto parts manufacturers stay a little above 10% of the total accruals, with the exception of a few notable spikes.
At the beginning of 2003, the car OEMs accounted for 74% of the industry's accruals, while the truck OEMs accounted for 14%, and the auto parts suppliers 12%.
At the beginning of 2013, the car OEMs made 57% of the industry's accruals, while the truck OEMs accrued 28% of the industry total, and the auto parts suppliers accrued 16%.
At the beginning of 2023, the car OEMs accrued 63% of the whole, the truck OEMs accrued 24%, and the auto parts suppliers accrued 13% of the U.S.-based industry's total.
We do see more fluctuation in accruals compared to claims, and similar to what we saw in Figures 2 and 3, there's been more variation since the Great Recession ended. The suppliers' proportion of the industry's total accruals peaked in the third quarter of 2018, at 28%. This was a temporary spike, with the auto suppliers' proportion dropping to 14% the next quarter. Other peaks came in 2009 and 2010, mid-2017, mid-2020, and a slighter peak at the beginning of 2022.
Warranty Reserves
Our third warranty metric in this report is the ending balance of each manufacturer's warranty reserve fund at the end of each quarter. Figure 6 shows the total warranty reserve balances for our three groups within the U.S.-based automotive industry.
Figure 6
Automotive Warranties:
Reserves Held by U.S.-based Manufacturers
(in US$ millions, 2003-2023)
The clear takeaway here is that the U.S. dollar inflation we've seen in the past few years has had a powerful impact on the hard numbers we see in our warranty reports. This is a big part of the reason we approached this report through the lens of proportionality, since the hard numbers don't tell the whole story. In other words, warranty costs are not up because products or parts are worse or failing more; everything is more expensive than it used to be, including parts, labor, and everything else associated with a warranty repair.
At the end of the third quarter of 2023, the car & small vehicle OEMs held a collective $24.81 billion in warranty reserves. The truck & large vehicle OEMs held $6.64 billion, and the auto parts suppliers held $4.36 billion. The industry-wide balance between all three groups was $35.82 billion, the fourth consecutive record-breaking quarter for this metric.
Our final chart, Figure 7, takes a look at these warranty reserve balance totals in proportion to each other over the past 20 years.
Figure 7
Automotive Warranties:
Reserves Held by U.S.-based Manufacturers
(as a percentage of 100%, 2003-2023)
The lines here are much smoother than we saw in Figures 2 or 5, because we're dealing with much larger numbers that don't vary as much in the short term. Still, these proportions have shifted gradually over time.
At the beginning of 2003, the car OEMs held 79% of the industry's warranty reserves, while the truck OEMs held just 10%, and the auto suppliers held 11%.
At the beginning of 2013, the car OEMs held 59% of the industry's reserves, while the truck OEMs held 26%, and the auto suppliers held 15%.
At the beginning of 2023, the car OEMs held 68%, the truck OEMs held 18%, and the auto suppliers held 13%.
A lot of the dynamics we see in Figure 7 are between the car & small vehicle OEMs and the truck & large vehicle OEMs. The auto suppliers' proportion of the industry's total reserves peaked in 2010 and 2011 at 19%, and again in 2018 and 2019 at 18%.