Largest Warranty Reserve Capacities:
The ratio between warranty reserves and total claims payments, which we call warranty reserve capacity, is always changing. And manufacturers in certain industries will have larger warranty reserve capacities, simply because they offer longer product warranties. This week we're looking at the companies with the largest warranty reserve capacities, and the highest standard deviations among these quarterly measurements.
This week we're analyzing an oft-overlooked warranty metric, warranty reserves, and more specifically, warranty reserve capacity.
In theory, every time a product with an attached warranty is sold, the manufacturer puts aside an amount of money for future warranty costs. These are warranty accruals, and they are deposited into the warranty reserve fund. Each company has a complex series of formulas that it uses to estimate what amount of accruals is needed in each quarter. And each company also has a quarterly warranty claims cost, which is the actual amount spent on product warranty during the same period.
The idea behind the warranty reserve fund, and measuring its capacity, is that if the manufacturer were to go bankrupt today, it would still be on the hook for warranty claims payments for the duration of its currently-extant product warranties. So each company should, in theory, have enough set aside to pay off all of its future warranty claims, even if there's no more accruals, and no more money available to add into the reserve fund.
Of course, a very large or very small warranty reserve capacity doesn't necessarily mean good or bad news. Boeing, for example, has one of the largest average warranty reserve capacities, but that makes sense, because airplanes come with long warranties. Certain industries, such as aerospace and home building, will offer long product warranties, and thus have large warranty reserve capacities, and some industries vice versa, such as auto parts, computer parts, and medical equipment.
Still, it's interesting to approach warranty statistics and spending in this way, especially those companies with the largest quarter-to-quarter variations (i.e., highest standard deviations) in their reserve capacities. So while we'll avoid comparing the companies in the following tables to each other, we can compare the companies in the following graphs to their own pasts, to see changes and variations over time.
Methodology
Typically, for each company, we report the amount of claims paid, the amount of accruals made, and the total reserves held at the end of a given period, usually a quarter. But today, we're going to explore the relationship between claims and reserves— or, in other words, the relationship between the actual amount spent and the total amount set aside for future spending— which we are calling warranty reserve capacity.
We calculate warranty reserve capacity with this formula:
Reserve Capacity = Reserve Fund Balance / Claims Paid Per Month
Our sample size for this report is the top 103 U.S.-based manufacturers, based on total warranty claims spending over their most recent eight quarters for which data is available. We collected these data by perusing each company's quarterly and annual reports, and extracting three key warranty metrics: total claims paid, total accruals made, and the end-balance of the warranty reserve fund.
To create the following table, Figure 1, we first calculated the warranty reserve capacity ratio for all 103 manufacturers, by dividing the quarter-ending warranty reserve fund balance by one-third of the quarterly claims total (in order to estimate claims paid per month based on the three-month quarterly totals).
We calculated eight warranty reserve capacity ratios for each manufacturer, for the most recent eight quarters for which data was available. For the majority of the manufacturers, these most recent eight quarters were the four quarters of 2022, and the four quarters of 2023. But some have yet to release their 2023 annual reports, so for those companies, the eight quarters we used were the fourth quarter of 2021, the four quarters of 2022, and the first three quarters of 2023. And of course, for those companies with fiscal years that differ from the calendar year, we simply used the most recent eight quarters available, regardless of dates, though they line up to roughly the same period.
After we calculated the eight warranty reserve capacity ratios, we averaged them together, to create the measure we call average reserve capacity, as seen in Figure 1. The claims totals presented in these tables are for the same eight quarters for which the ratios were calculated, and the reserve balance shown is the end-balance for the most recent quarter for which data was available.
For the following charts, Figures 2-6, we present the quarterly warranty reserve capacity ratios starting at the beginning of 2021, up until the most recent quarter available, either the third or fourth quarter of 2023. These ratios are calculated using the formula above. These charts show those companies with the largest warranty reserve capacities among our top 103 companies, as well as those with the largest standard deviations, to show the variation and volatility that the eight-quarter averages can flatten out.
In next week's newsletter, we'll look at the foil to these charts, the smallest warranty reserve capacities.
To set a baseline, we'll let you know that the average of all of the average warranty reserve capacities among the 103 companies was 29 months. Ford and General Motors both had average reserve capacities of 26 months. Deere had an average capacity of 25 months. And Tesla had an average capacity of 43 months.
Largest Warranty Reserve Capacities
Figure 1 shows the top ten companies with the largest average warranty reserve capacities over the most recent eight quarters available.
For all but Proterra Inc. and Landsea Homes Corp., the eight quarters are the four quarters of 2022, and the four quarters of 2023. Proterra and Landsea have yet to report their fourth quarter 2023 data, so we used the fourth quarter of 2021, the four quarters of 2022, and the first three quarters of 2023 for these calculations.
Figure 1
Top U.S.-based Product Warranty Providers:
Largest Warranty Reserve Capacities
2021 to 2023
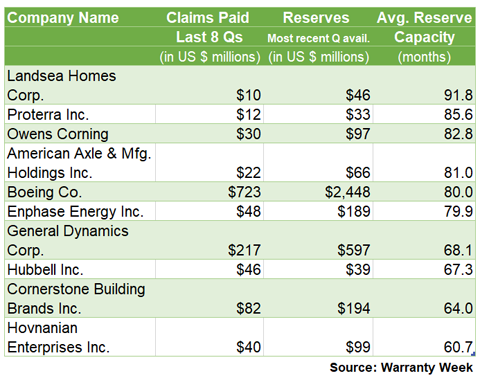
Figure 1 is dominated by new home builders and building components suppliers, which typically come with longer product warranties. Landsea Homes, a new home builder, tops the list, with an average reserve capacity of about 92 months. Owens Corning, in third with an average capacity of 83 months, is a home building materials supplier, which makes roofing shingles, insulation, and fiberglass composite materials. Hubbell Inc., in eighth with an average capacity of 67 months, makes electrical components and accessories for construction. Cornerstone Building Brands, with an average reserve capacity of 64 months, is the product of the 2018 merger of NCI Building Systems and Ply Gem Parent, and makes exterior building products and metal components for construction. And Hovnanian, with a reserve capacity of 61 months, is a new home builder that constructs single-family homes, townhouses, condos, and retirement homes.
In the second spot in Figure 1 is Proterra, an electric bus and powertrain manufacturer with a reserve capacity of about 86 months. Also in the automobile drivetrain business is American Axle, in the fourth spot of Figure 1, with an average reserve capacity of 81 months.
Boeing, in fifth with a reserve capacity of 80 months, and General Dynamics, in seventh with a reserve capacity of 68 months, are both aerospace manufacturers. Note that General Dynamics does not offer product warranties on its military products, just its civilian offerings such as the Gulfstream business jets.
Surprisingly, we only have one solar manufacturer in Figure 1, Enphase Energy, with an average warranty reserve capacity of 80 months. Enphase makes solar micro-inverters, energy storage batteries, and residential EV charging stations, but not the actual solar panels. We'll note that a couple of other solar manufacturers were just short of the top ten, including SunPower Corp. in twelfth with a capacity of 56 months, and First Solar Inc. in thirteenth with a capacity of 54 months.
Also just shy of the top ten were Teledyne Technologies Inc., in eleventh with an average reserve capacity of 58 months, Visteon Corp., in fourteenth with a capacity of 53 months, and Cummins Inc., in fifteenth with a capacity of 50 months.
Landsea Homes
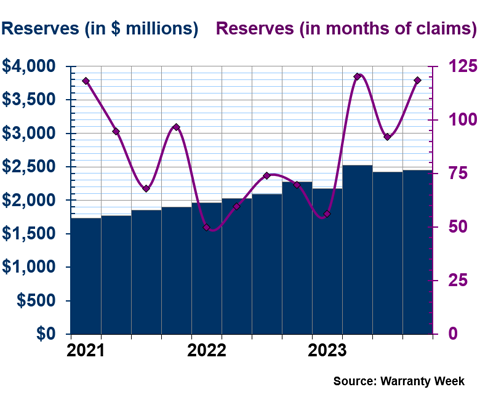
In the following few charts, we'll hone in on the past three years of warranty reserves and reserve capacities for some of the companies shown in Figure 1. Figure 2 shows the warranty reserve capacity of Landsea, which had the largest reserve capacity of all 103 companies.
Figure 2
Landsea Homes Co.
Warranty Reserve Capacity
2021 to 2023
(in US$ millions & months)
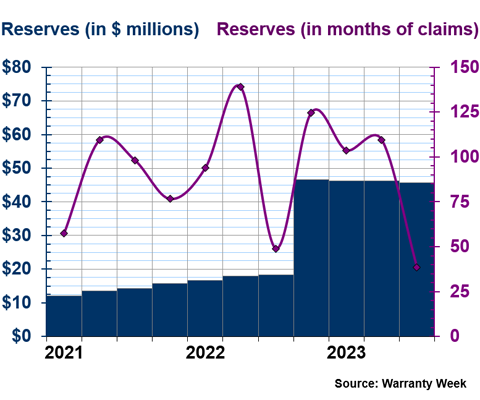
Landsea is a new home builder that is active in Arizona, Texas, California, Colorado, Florida, and New York City. The company mainly builds single-family homes and townhomes in new-build housing developments, but also builds some condominiums, such as in New York City.
As we saw in Figure 1, Landsea paid only $10 million in claims over two years, but held $46 million in its warranty reserves at the end of the third quarter of 2023.
We can see in Figure 2 that the balance of the warranty reserve fund rose significantly from the end of the third quarter of 2022 to the end of the fourth quarter of that year. This seems to have been prompted by claims costs almost tripling from the second to the third quarter of 2022. This explains the big drop in capacity in the third quarter of that year. Similarly, claims costs for the company again came close to tripling, from the second to the third quarter of 2023.
While Landsea's 2023 annual report, including its fourth quarter warranty data, is expected imminently, it was not available at the time of publishing this newsletter. We will keep an eye on this to see where the company's claims payments, and thus warranty reserve capacity, go from here.
Proterra
Figure 3 details the warranty claims and reserve capacity of Proterra from 2021 to 2023.
Figure 3
Proterra Inc.
Warranty Reserve Capacity
2021 to 2023
(in US$ millions & months)
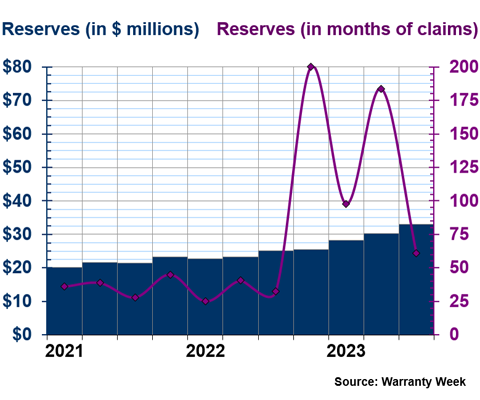
Proterra is an electric bus and powertrain manufacturer, which filed for Chapter 11 bankruptcy in August of last year, as we reported in our "U.S. EV-Only Warranty Expense Rates" newsletter. Volvo Group (Volvo Truck) acquired the company's powertrain business in mid-November 2023, Phoenix Motor acquired its electric transit bus division, and Coulomb Solutions Inc. (CSI) acquired its charging business. As such, this will be one of the last times we look at the warranty expenses of this company.
Proterra saw its claims costs rise over 2021 and 2022, as its business grew, but something went off the rails at the end of 2022, with claims costs dropping by -80% from the third to the fourth quarter of that year. Lower claims should be a good thing, indicating newfound savings on warranty expenses, but in this case, may have been a harbinger of doom, since the bankruptcy news came less than a year after this big change in reserve capacity.
Proterra's warranty reserve capacity ratios from 2021 to 2023 had the third-highest standard deviation of any company, meaning that the ratio was very volatile. The highest standard deviation of all 103 companies belonged to Hubbell Inc. shown in Figure 4.
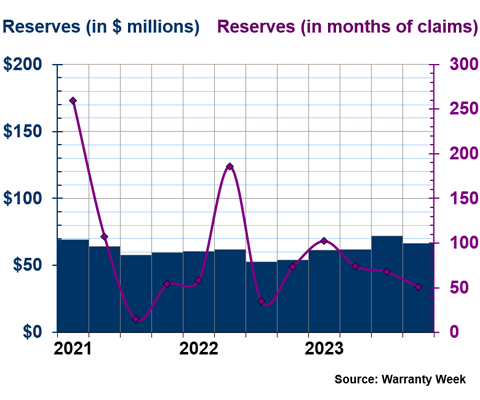
Hubbell
Figure 4
Hubbell Inc.
Warranty Reserve Capacity
2021 to 2023
(in US$ millions & months)
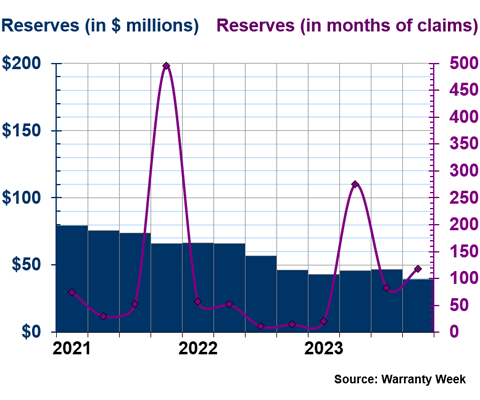
Hubbell's quarterly claims payments have been erratic since the start of 2021. The company's claims payments doubled from the first quarter of 2021 to the second, and then halved from the second to the third, and fell in half again from the third to the fourth.
Homebuilders do see their warranty claims and accruals follow seasonal patterns, but Hubbell is a parts supplier for homebuilders, so we wouldn't necessarily expect the same impact of seasonal home buying trends on its warranty costs. Certainly, the quadrupling of its warranty claims costs from the second to the third quarter of 2022 cannot be explained simply by consumer behavior.
These huge variations in quarterly, and thus average monthly, claims costs explain the oscillations in Figure 4, as well as the extremely high standard deviation for the company's average warranty reserve capacity ratios.
Hubbell's most recent eight quarters of reserve capacities average to 67 months, as shown in Figure 1, but the company's largest reserve capacity since the beginning of 2021 was a capacity of 496 months in the fourth quarter of 2021. Within the eight-quarter frame used to create Figure 1, Hubbell's largest reserve capacity was 275 months in the second quarter of 2023, and the smallest reserve capacity was 11 months, in the third quarter of 2022. This is by far the most volatility of any company in this report, and among the top 103 manufacturers overall.
Boeing
Figure 5 takes a look at the warranty reserves and reserve capacity ratios of Boeing, by far the company with the highest warranty claims spending and largest reserves of the ten manufacturers depicted in Figure 1.
Figure 5
Boeing Co.
Warranty Reserve Capacity
2021 to 2023
(in US$ millions & months)
Boeing had the fifth-largest reserve capacity in months of the 103 companies, but one of the smaller standard deviations among the ten largest capacities. General Dynamics, its fellow in the aerospace sector, had the smallest standard deviation among the top ten. Simply put, this means that Boeing and General Dynamics were in Figure 1 mainly because airplanes come with long warranties. They're consistent in having large warranty reserve capacities, because they always want to be prepared to pay out the length of all of their extant warranties.
We're not saying Boeing doesn't have any volatility in its reserve capacity, but we are saying that it has the least amount of volatility among those with the largest average warranty reserve capacities.
Boeing's claims costs rose in 2022, which led to the warranty reserve capacity decreasing. But the company increased its accruals and started growing its warranty reserve fund in 2023, so the reserve capacity has increased in the past few quarters.
It will be very interesting to see what comes next for Boeing's warranty costs and metrics over 2024. As we reported in our recent newsletter "Warranty Adjustments," Boeing is likely looking at another round of groundings and recalls for the 737 MAX, after the viral video of the door panel flying off of an Alaska Airlines flight mid-air. That panel breakage happened in January 2024, just after our data ends. So we'll see what happens next for Boeing. With all of these issues and malfunctions, it seems like no matter how much the company sets aside for warranty costs, changes of estimate and additional deposits into the warranty reserve continue to become necessary.
American Axle
Figure 6 shows the warranty reserves and capacity ratio for American Axle from 2021 to 2023.
Figure 6
American Axle & Mfg. Holdings Inc.
Warranty Reserve Capacity
2021 to 2023
(in US$ millions & months)
American Axle had the second-highest standard deviation for its warranty reserve capacity ratios from 2021 to 2023, meaning that the only company on the list of 103 that was more volatile was Hubbell. This is mainly the result of American Axle's claims costs sextupling from the second to the third quarter of 2021, leading the warranty capacity ratio to drop significantly. Something similar happened in mid-2022, with total claims dropping by more than half from the first to the second quarter of 2022, only for the metric to quadruple from the second to the third quarter of the year.
While we're talking about variations of a few million dollars, this makes a significant impact on the warranty reserve capacity ratio when quarterly claims costs are usually around $3 million, and they rise to $10 million, for example. It's all about each company's proportionality and relationship to its own past, which is why we'd consider American Axle more volatile in terms of reserve capacity than Boeing, despite the numbers for the two being on different scales.
So American Axle is usually ready to pay somewhere between 50 and 100 months of future claims with the money sitting in its warranty reserve fund. But huge variations in quarterly claims costs have caused the reserve capacity ratio to rise as high as 260 months, and fall as low as 15 months, within the same year no less. It's difficult to predict how much money needs to be sitting in the warranty reserve fund if there's no reliable way to predict how much claims will cost in a given period, which is exactly why the warranty reserve capacity ratio is important.
Keep an eye out for next week's newsletter, in which we will take a similar look at the smallest warranty reserve capacities among the same sample of the top 103 U.S.-based manufacturers!