U.S. Auto Parts & Powertrain Warranty Expenses:
The auto parts manufacturers set new record highs for total warranty claims paid and reserves held in 2024. Within the industry, the subset of powertrain manufacturers tend to have higher warranty expense rates, since they generally have more direct contact with the end-user, compared to tier one and tier two suppliers.
For the last two weeks, we've looked at the product warranty expenses of passenger and commercial vehicle OEMs. Since these manufacturers sell directly to the end-user, their warranty expense rates tend to be higher.
In short, this is because OEMs often don't think it's worth it to file all of the paperwork, send the emails, send the follow-up emails, and so on, just to ask their suppliers to reimburse them for one or two warranty claims. At a certain point, the OEM becomes willing to eat the cost of a few faulty parts.
However, we have seen this trend shift a bit in recent years, especially on the passenger car side, where OEMs are increasingly viewing supplier recovery as a cost-cutting measure to balance out warranty expenses increasing due to recalls, inflation, and rising labor costs. We especially saw this with GM and the Bolt battery recall. Ultimately, GM recovered at least 90% of the cost of that recall from its battery supplier. We went into greater detail on this in our December 14, 2023 newsletter "U.S. Auto OEM & Supplier Warranty Update."
This week, we're going to take a look at the warranty expenses of those auto parts suppliers, including tier one suppliers that sell to OEMs, aftermarket parts suppliers that sell to auto shops, and parts retailers that sell directly to consumers.
It's a much larger roster of companies, but their warranty expense rates tend to be lower, because their relative lack of contact with the end-user means they're generally dealing with a much smaller volume of warranty claims.
In addition, we can break the auto parts industry into two distinct groups, the powertrain manufacturers and the other auto parts manufacturers. Because of the difference in the amount of contact with the end-user, there's a marked difference in the warranty expense rates between the two groups, with the powertrain manufacturers tending to have higher expense rates. Generally, the more intermediaries between the manufacturer and the end-user, the lower the warranty expense rates.
By far, the largest U.S.-based auto parts company by warranty expenses is Cummins Inc., a powertrain manufacturer that sells directly to consumers of commercial vehicles. Cummins sells directly to heavy duty truck owners.
Along with Cummins, the largest manufacturers in this industry by warranty expenses are: O'Reilly Automotive Inc., Standard Motor Products Inc., Brunswick Corp., Westinghouse Air Brake Technologies Corp. (WABTECH), LKQ Corp., BorgWarner Inc., Eaton Corp. plc, Dana Inc., LCI Industries, Illinois Tool Works Inc., Fox Factory Holding Corp., and Visteon Corp.
Amongst the top companies in the auto parts industry, we find a good representative sample of the different types of manufacturers. There's Cummins, which sells powertrain and engine components both directly to consumers of heavy trucks and to vehicle OEMs; Standard Motor Products and LKQ Corp., aftermarket parts distributors; BorgWarner and Dana, tier one suppliers to vehicle OEMs; and O'Reilly and AutoZone, a parts retailer.
Note that Tenneco no longer reports, after being acquired by private equity fund Apollo Global Management at the end of 2022. Cummins acquired Meritor Inc. in mid-2022, so its warranty expenses are still represented in these data, but not under a separate company heading.
In total, we identified 136 auto parts manufacturers that have reported warranty expenses from 2003 to 2024, 55 of which reported in 2024.
We perused their annual reports and quarterly financial statements, and gathered three key warranty metrics: the amount of claims paid, the amount of accruals made, and the end-balance of the warranty reserve fund.
In addition, we gathered data on each manufacturer's segmented product sales revenue, excluding revenue generated from financing, extended warranty, etc. Using these data, we calculated two additional warranty expense rates: claims as a percentage of product sales (the claims rate), and accruals as a percentage of product sales (the accrual rate).
Warranty Claims Totals
Figure 1 shows the total warranty claims paid by the U.S.-based auto parts manufacturers, from 2003 to 2024.
Figure 1
U.S.-based Auto Parts & Powertrain Manufacturers
Claims Paid per Year
(in millions of U.S. dollars, 2003-2024)
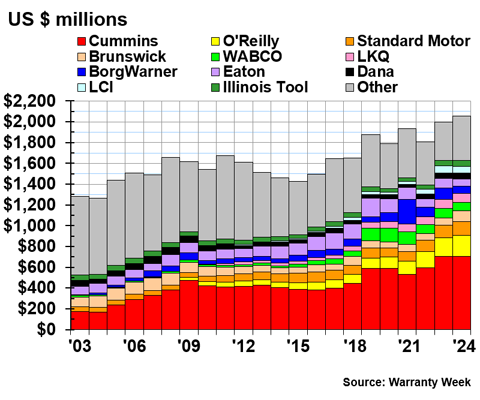
In 2024, the U.S.-based auto parts manufacturers paid a total of $2.058 billion in warranty claims, a 3% increase from the year prior.
Cummins paid $704 million in claims in 2024, a minute -0.14% decrease from 2023.
Cummins also had some large expenses related to emissions violations, which were not counted as warranty expenses, and thus don't show up in Figure 1. As noted in Cummins' 2024 annual report,
"In December 2023, we announced that we reached an agreement in principle with the U.S. Environmental Protection Agency (EPA), the California Air Resources Board (CARB), the Environmental and Natural Resources Division of the U.S. Department of Justice (DOJ) and the California Attorney General's Office to resolve certain regulatory civil claims regarding our emissions certification and compliance process for certain engines primarily used in pick-up truck applications in the U.S., which became final and effective in April 2024 (collectively, the Settlement Agreements). In the second quarter of 2024, we made $1.9 billion of payments required by the Settlement Agreements.
Furthermore, the annual report detailed,
"In December 2023, we announced that we reached the agreement in principle with EPA, CARB, the Environmental and Natural Resources Division of the DOJ and the California Attorney General's Office to resolve certain regulatory civil claims regarding our emissions certification and compliance process for certain engines primarily used in pick-up truck applications in the U.S., which became final and effective in April 2024, (collectively, the Settlement Agreements). As part of the Settlement Agreements, among other things, we agreed to pay civil penalties, complete recall requirements, undertake mitigation projects, provide extended warranties, undertake certain testing, take certain corporate compliance measures and make other payments. Failure to comply with the terms and conditions of the Settlement Agreements will subject us to further stipulated penalties. We recorded a charge of $2.0 billion in the fourth quarter of 2023, in other operating expense, net in our Consolidated Statements of Income, to resolve the matters addressed by the Settlement Agreements involving approximately one million of our pick-up truck applications in the U.S. Of the $2.0 billion charge, $1.7 billion (primarily related to penalties) was non-deductible for U.S. federal income tax purposes. The remaining amount, related to emissions mitigation projects and payments, extended warranties and other related compliance expenses was deductible for U.S. federal income tax purposes. This charge was in addition to the previously announced charges of $59 million for the recalls of model years 2013 through 2018 RAM 2500 and 3500 trucks and model years 2016 through 2019 Titan trucks. We made $1.9 billion of payments required by the Settlement Agreements in the second quarter of 2024. Subsequent to the second quarter of 2024, we have recorded immaterial amounts related to stipulated penalties we determined to be probable and estimable. Any further non-compliance with the Settlement Agreements will likely subject us to further stipulated penalties and other adverse consequences."
O'Reilly Automotive paid $204 million in claims, a 13% increase from the year prior. Standard Motor Products paid $131 million, an 11% increase. Brunswick paid $102 million, a 42% increase.
WABTECH paid $85 million, in claims, a -9% decrease from the year prior. LKQ Corp. also paid $85 million, a 2% increase. BorgWarner paid $71 million in claims, a -35% decrease. And Eaton paid $65 million, a -29% decrease.
Dana paid $61 million, a 9% increase from the year prior. LCI paid $61 million, a -10% decrease. And Illinois Tool Works paid $58 million, a 14% increase.
In the "Other" category, Aptiv plc paid $57 million in claims in 2024, a 21% increase from the year prior. Allison Transmission Holdings Inc. paid $41 million, the same amount as the year prior.
Shoals Technologies Group Inc. paid $29 million in claims in its second year of reporting, a 460% increase from 2023's total of $5 million. Visteon Corp. paid $22 million, a 29% increase from the year prior. Regal Rexnord Corp. paid $22 million, a -6% decrease.
Goodyear Tire & Rubber Co. paid $20 million, a 5% increase. And American Axle & Mfg. Holdings Inc. paid $20 million, a 75% increase from 2023's total of $11 million.
Warranty Accrual Totals
Figure 2 shows the total amount of warranty accruals made by the auto parts manufacturers, from 2003 to 2024.
Figure 2
U.S.-based Auto Parts & Powertrain Manufacturers
Accruals Made per Year
(in millions of U.S. dollars, 2003-2024)
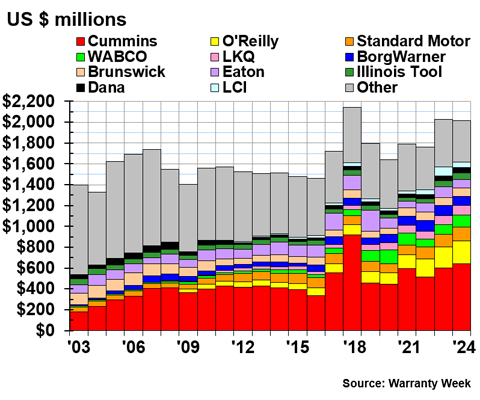
In 2024, the U.S.-based auto parts manufacturers set aside a total of $2.017 billion in warranty accruals, a -1% decrease from 2023.
Cummins set aside $641 million in warranty accruals, a 6% increase from the year prior. O'Reilly accrued $219 million, a 9% increase. And Standard Motor Products accrued $135 million, a 12% increase.
WABTECH accrued $117 million in 2024, a 23% increase from the year prior. LKQ accrued $89 million, a 3% increase. BorgWarner accrued $85 million in 2024, a -13% decrease. Brunswick accrued $83 million, a 6% increase. And Eaton accrued $81 million, a -19% decrease.
Illinois Tool Works accrued $63 million, a 13% increase from the year prior. Dana accrued $53 million, a 4% increase. And LCI accrued $49 million, a -41% decrease.
In the "Other" category, Aptiv accrued $33 million in 2024, a 6% increase from the year prior. Allison Transmission accrued $33 million, an 18% increase. Visteon also accrued $33 million, a 3% increase. And Regal Rexnord accrued $22 million, a -1% decrease.
Warranty Expense Rates
As we posited at the beginning of this newsletter, the powertrain suppliers tend to have higher warranty expense rates than the other auto parts suppliers, because of differences in how they conduct business and interact with end-users. Of course, there are more nuances within the other auto parts category, such as the differences between tier two suppliers, retailers, and aftermarket parts makers. However, the overarching dichotomy stands, as we will see in Figures 3 and 4.
Figure 3 shows the quarterly warranty expense rates of the powertrain manufacturers, and Figure 4 shows the expense rates of the other auto parts manufacturers, from 2003 to 2024. We set Figures 3 and 4 on the same y-axes, for ease of comparison.
Figure 3
U.S.-based Powertrain Manufacturers
Average Claims and Accrual Rates
(as a % of product sales, 2003-2024)
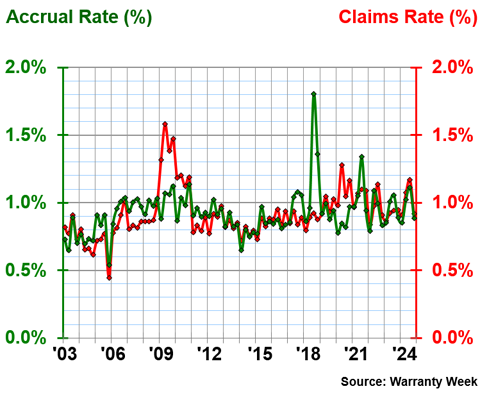
Over 22 years, the U.S.-based powertrain manufacturers had an average warranty claims rate of 0.92%, with a standard deviation of 0.18%, and an average warranty accrual rate of 0.93%, with a standard deviation of 0.16%.
In 2024, the powertrain manufacturers had an average warranty claims rate of 1.02%. The quarterly values ranged from 0.91% in the first quarter, to 1.17% in the third quarter.
The powertrain manufacturers had an average warranty accrual rate of 0.97% in 2024. The quarterly values ranged from 0.85% in the first quarter, to 1.11% in the third quarter.
Figure 4
U.S.-based Auto Parts Manufacturers
Average Claims and Accrual Rates
(as a % of product sales, 2003-2024)
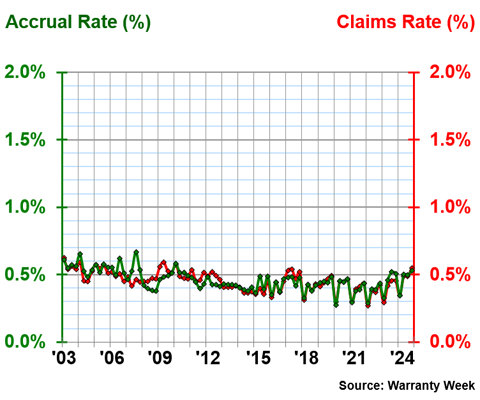
Over 22 years, the U.S.-based manufacturers of other auto parts had an average warranty claims rate of 0.45%, with a standard deviation of 0.07%, and an average accrual rate of 0.46%, with a standard deviation of 0.08%.
Notice that not only are the average expense rates for other auto parts manufacturers lower than those of the powertrain manufacturers, but the standard deviations are lower as well. This means that the other auto parts manufacturers have more consistent quarterly expense rates, with fewer peaks and valleys, as well as lower average expense rates overall.
In 2024, the other auto parts manufacturers had an average warranty claims rate of 0.47%. The quarterly values ranged from 0.34% in the first quarter, to 0.55% in the fourth quarter.
The other auto parts manufacturers had an average warranty accrual rate of 0.47% in 2024. The quarterly values ranged from 0.34% in the first quarter, to 0.53% in the fourth quarter.
Warranty Reserve Balances
Figure 5 shows the year-end balance of each auto parts manufacturer's warranty reserve fund, from 2003 to 2024.
Figure 5
U.S.-based Auto Parts & Powertrain Manufacturers
Reserves Held per Year
(in millions of U.S. dollars, 2003-2024)
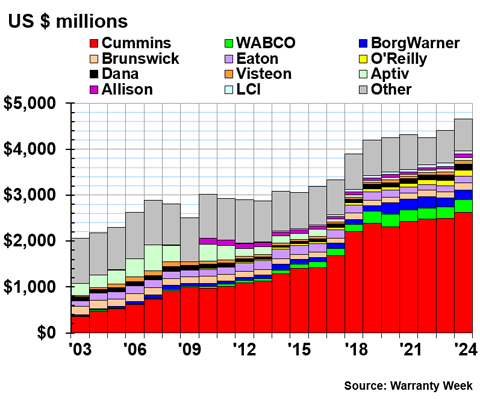
At the end of 2024, the auto parts manufacturers held a total of $4.659 billion in warranty reserves, a 6% increase from the end of 2023.
At the end of 2024, Cummins held $2.623 billion in warranty reserves, a 5% increase from the end of 2023.
WABTECH held $274 million, a 10% increase from the end of the year prior. BorgWarner held $215 million, a 10% increase. Brunswick held $153 million, a 20% increase. Eaton held $150 million, a 10% increase. O'Reilly held $133 million, a 13% increase. And Dana held $123 million, a 6% increase.
Visteon held $80 million, a 13% increase from the end of the year prior. Aptiv held $74 million, a 21% increase. Allison Transmission held $67 million, a 14% increase. And LCI held $65 million, a -9% decrease.
In the "Other" category, American Axle held $61 million, a -9% decrease from the end of the year prior. Illinois Tool Works held $52 million, an 8% increase. AutoZone Inc. held $48 million, an 8% increase. Shoals Technologies Group held $41 million, a -25% decrease.
LKQ held $39 million, an 11% increase. Regal Rexnord held $33 million, a -3% decrease. CarMax Inc. held $29 million, a 15% increase. Stoneridge Inc. held $28 million, a 27% increase. Lear Corp. held $27 million, a -16% decrease. Carlisle Cos. Inc. held $26 million, a 5% increase. And Standard Motor Products held $25 million, a 17% increase from the end of the year prior.
Catch the rest of our series of 22-year charts:
- "Twenty-Second Annual Product Warranty Report"
- "New Home Builder Warranty Report"
- "U.S. Small Vehicle Warranty Expenses"
- "U.S. Truck, Bus, & Heavy Equipment Warranty Expenses"