
Site-Built New Home Warranty Report:
Total warranty claims, accruals, and reserves continue to rise for the site-built new home industry. Some companies are struggling to predict their warranty costs and set aside a steady amount per home sold, while others are incredibly consistent.
We are very excited to bring our readers the 2023 annual product warranty data, a multi-month series that we'll officially begin with our next newsletter. As a preview, this week we're bringing you a special report about the annual warranty metrics of a key subset of the U.S.-based housing market, the new home builders.
Since 2003, we've been collecting warranty expense data for a list of about 60 new home builders. Some of these companies went bust during the Great Recession, and others have merged or been acquired, either by each other or by private equity. This week, we're taking a look at the warranty expense data of a subset of 23 companies among that list, those currently active or recently out of business, in order to shed light specifically on the warranty costs for site-built new homes in 2023.
This report is excluding manufacturers of HVAC systems, appliances, sheetrock, lighting fixtures, furniture, and other suppliers of building materials. This report is also excluding homebuilders that make manufactured homes, mobile homes, and other homes that are not site-built. This means that this newsletter is using a different data set than our "Nine-Month New Home Warranty Update" from last December, so the quarterly industry totals provided are slightly different. In fact, the two largest companies excluded by these criteria are Skyline Champion and Cavco, both of which we discussed in last week's newsletter "Smallest Warranty Reserve Capacities."
As such, we've included data on industry totals from the past ten years, rather than from the beginning of 2003, although we have the data available. This is simply because the 23 companies we're highlighting and analyzing in Figures 5-10 were accompanied by many others in the industry before the Great Recession. The historical data for this specific subset of 23 companies in this industry would simply not be representative of what the industry's total warranty expenses were really like back then.
Also keep in mind that many major new home builders in the United States are privately owned, or do not report their warranty expenses. Thus, based on housing data from the U.S. Census Bureau, we estimate that our data set for this newsletter represents about 47% of the new homes built in the United States during 2023. However, go back to 2003, and this same set of 23 companies only represents 21% of the new homes built that year. For charts showing these historic data by quarter, take a look here or here, and for annual data, take a look here.
For each of the 23 companies depicted in this newsletter, we perused their quarterly financial statements and annual reports, and gathered three key warranty metrics: the amount of claims paid, the amount of accruals made, and the amount of reserves held. We also gathered data on the amount of homebuilding revenue they reported (minus land sales and mortgage-lending income, if any), as well as the number of homes they sold. Using these data, we were also able to calculate the dollar amount of accruals set aside per home sold (calculated by dividing the accrual total by the number of homes closed).
We'll provide you with a few statistics before we get started with the warranty data. From 2022 to 2023, the number of site-built homes sold in the United States increased by 3.9%, according to the U.S. Census Bureau, and the number of site-built homes sold by the 23 companies in this newsletter increased by 3.7%. So while these companies represent about half of the new homes sold in the United States in 2023, they are fairly representative of the industry as a whole.
These figures actually represent a bit of stagnation for the industry since the pandemic housing boom. From 2019 to 2020, the homebuilders in this newsletter saw their number of new homes sold increase by about 11%, and from 2020 to 2021, this figure increased an additional 14%. The figure fell by about 1% from 2021 to 2022, so the 4% increase from 2022 to 2023 shows a bit of growth, but nowhere near the same level as we saw a few years ago. Keep this astronomic growth in 2020 and 2021 in mind as we look at the following claims and accrual totals, because warranty claims for homes sold a couple of years ago are coming in now, and driving warranty expenses up across the industry.
Warranty Claims Totals
Figure 1 shows the collective warranty claims costs for the 23 homebuilders in this newsletter over the past ten years.
Figure 1
Homebuilding Warranties:
Claims Paid per Quarter by U.S.-based Builders
(in millions of U.S. dollars, 2014-2023)
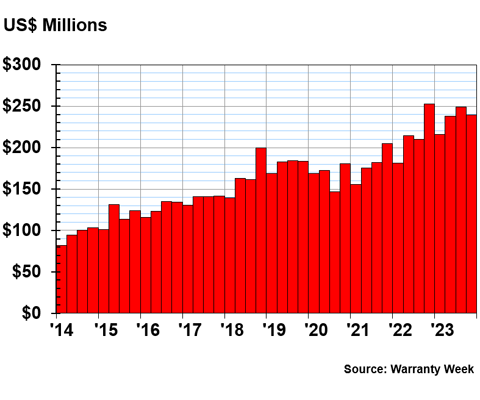
These homebuilders spent $240 million on warranty claims costs during the fourth quarter of 2023, down about -5% compared to the fourth quarter of 2022. Both the first and third quarters of 2023 saw warranty claims costs increase by 19% compared to the respective quarters during 2022, and the second quarter saw an increase of 11% in claims costs compared to the second quarter of 2022. So the fourth quarter was the only quarter of 2023 where claims costs were lower than they were during the same quarter the year prior.
For 2023 as a whole, these homebuilders spent $942 million on warranty claims, up about 10% from 2022's annual total of $858 million in claims costs.
Annual claims costs increased from 2022 to 2023 for Lennar Corp., PulteGroup Inc., NVR Inc., Hovnanian Enterprises Inc., D.R. Horton Inc., Toll Brothers Inc., KB Home, M/I Homes Inc., M.D.C. Holdings Inc., Taylor Morrison Home Corp., Green Brick Partners Inc., and Landsea Homes Corp.
Newcomer Landsea Homes, which started reporting in 2020, saw the largest increase, with claims costs more than doubling from $3.2 million in 2022 to $8.2 million in 2023. KB Home saw annual claims rise by 34% from 2022 to 2023, followed by M.D.C. with a 29% increase.
Only Beazer Homes USA Inc., Meritage Homes Corp., Century Communities Inc., and LGI Homes Inc. saw their claims costs decrease from 2022 to 2023. Among them, LGI saw the largest decrease, with total claims down -34%, or $2.9 million, from 2022 to 2023.
Warranty Accrual Totals
Figure 2 shows warranty accruals for these companies for the past ten years.
Figure 2
Homebuilding Warranties:
Accruals Made per Quarter by U.S.-based Builders
(in millions of U.S. dollars, 2014-2023)
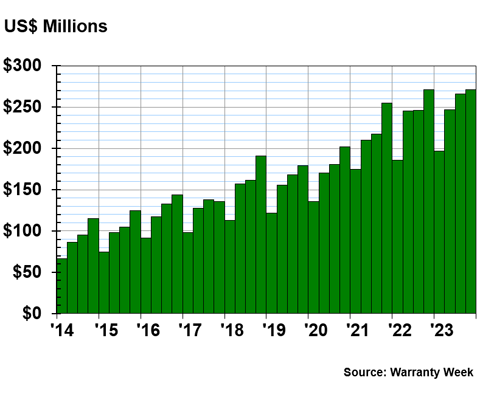
These homebuilders set aside $271 million in warranty accruals during the fourth quarter of 2023, just about the same amount as they set aside during the fourth quarter of 2022. They accrued $981 million during 2023, up 3% from 2022.
Lennar, PulteGroup, D.R. Horton, Toll Brothers, Meritage, Taylor Morrison, and Green Brick increased their annual accruals from 2022 to 2023. Among them, PulteGroup increased its accruals the most, by 26%.
NVR, Hovnanian, Beazer Homes, KB Home, M/I Homes, M.D.C., Century Communities, LGI Homes, and Landsea Homes all decreased their warranty accruals from 2022 to 2023, with Landsea making the largest decrease of -35%. Recall that Landsea also saw the largest increase in annual claims costs during the same period.
Hovnanian is in a similar situation, having decreased its accruals by -21% from 2022 to 2023, despite its claims costs rising by 21% during the same period.
Warranty Reserve Totals
Figure 3 shows the collective warranty reserve balances of these 23 companies over the past ten years.
Figure 3
Homebuilding Warranties:
Reserves Held per Quarter by U.S.-based Builders
(in millions of U.S. dollars, 2014-2023)
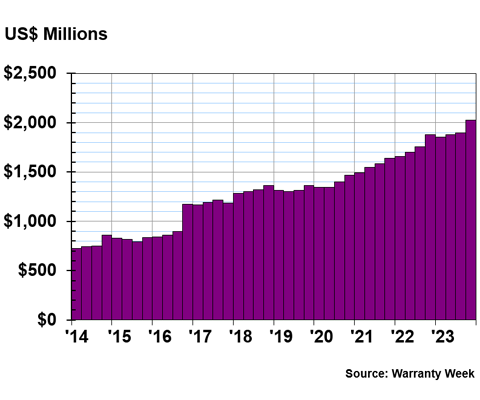
At the end of the fourth quarter of 2023, these homebuilders held a collective $2.024 billion in their warranty reserve funds. This was the first time this group of companies crossed the threshold of $2 billion.
Reserve balances have been steadily on the rise since 2020 for these companies, with the exception of the fourth quarter of 2022 into the first quarter of 2023, when there was a slight decrease.
Accruals per Home Sold
Next, we are going to delve into the accruals per home sold of all of the specific builders in in this report.
But first, we are going to provide a bit of context in the form of Figure 4, which shows the industry average accrual rate per home sold from the beginning of 2003.
Figure 4
Homebuilding Warranties:
Average Warranty Accruals Made per Unit Sold
(in U.S. dollars, 2003-2023)
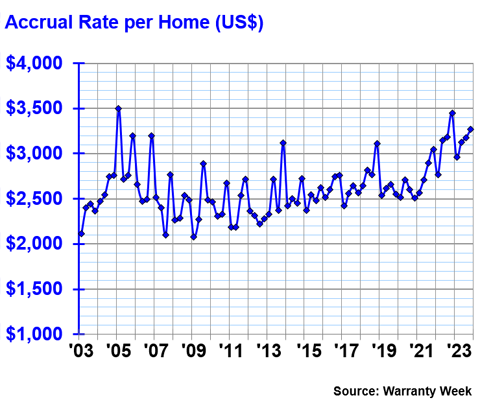
The average amount of accruals made per home sold during the fourth quarter of 2023 was $3,266 for these companies. This is down about -5% compared to the industry average for the fourth quarter of 2022.
We can see in Figure 4 that companies are accruing around $500 to $750 more per home than they did as recently as 2020.
The 21-year average is $2,622 per home sold. The industry was right around that average in 2020, so the recent increases in quarterly accruals per home sold represent a deviation from the norm.
Accrual Rates for Specific Builders
Figures 5-10 show the average quarterly accruals per home sold for each of the builders included in this newsletter. They're grouped based on their minimums and maximums, so pay attention to the different scales on the y-axes of these charts. Figure 5 shows the companies with the highest maximums, and things will get less volatile as we go. But keep in mind that the companies included in Figure 10, for instance, would look like straight lines on the scale of Figure 5.
Figure 5
Homebuilding Warranties:
Warranty Accruals Made per Unit Sold
(in U.S. dollars, 2003-2023)
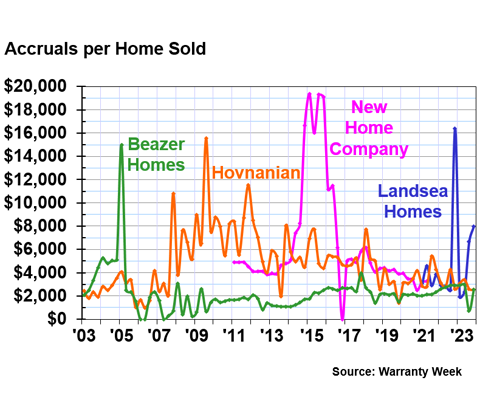
Beazer Homes and Hovnanian struggled more with warranty accounting before and during the Great Recession, and while they remain a but volatile and variable, things have clearly smoothed out, relatively speaking. Landsea Homes is a newcomer that only started reporting in 2020, and seems to have yet to master its warranty accrual formula. And the New Home Co. is a bit of a cautionary tale here, because its high degree of volatility for this metric, while smoothed out a bit after about five years of reporting, was a harbinger of the company's troubles, which ultimately led to it being acquired by Apollo Global Management in 2021.
Beazer Homes' maximum of $14,986 per home sold came in the first quarter of 2005, and the minimums of $0 came during 2006 and 2007, with some very low numbers in 2008 and 2009 as well. The company has regulated itself since then, for the most part staying within the $2,000 to $3,000 range per quarter. However, the company deviated again in the third quarter of 2023, when it accrued just $721 per home sold.
Hovnanian's maximum of $15,536 per home sold came during 2009. The company has not smoothed out as much as Beazer since the Great Recession, and is still one of the more volatile of the homebuilders we're tracking. We're still seeing differences of $2,000 to $3,000 just year-over-year. Still, we'll give them credit for being less volatile now than they were for the decade between 2007 and 2017.
Landsea's accruals per home sold have varied from $16,376 in the fourth quarter of 2022 to $1,930 in the first quarter of 2023.
The y-axis scale of Figure 6 is smaller, but there's still a lot of volatility among some of the following companies.
Figure 6
Homebuilding Warranties:
Warranty Accruals Made per Unit Sold
(in U.S. dollars, 2003-2023)
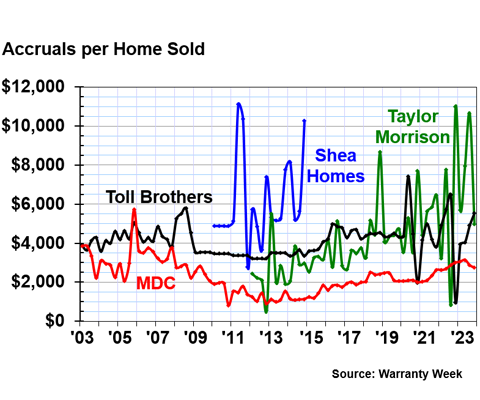
We have Taylor Morrison, which set a new maximum in the fourth quarter of 2022 at $10,989 in accruals per home sold. The minimum of $553 per home sold came in 2012, soon after the company started reporting, but they came close as recent as the third quarter of 2022, with $824 per home. Accruing too little in the third quarter of 2022, just to increase accruals to an extreme in the fourth quarter of the year, is not a very sound or sustainable warranty accounting strategy. The company came close to the maximum again in the third quarter of 2023, with $10,639 per home sold. So Taylor Morrison hasn't learned a lesson; if anything, its warranty accounting practices are becoming more volatile over time.
Toll Brothers is another company that's been getting more volatile with its warranty accounting in the past few years. It was steady around $4,500 per home from 2009 to 2016, but has really gone off the rails since 2020. The new minimum of $963 per home in the fourth quarter of 2022 is cause for concern, as is the maximum of $7,425 in the second quarter of 2020.
Both Toll Brothers and Taylor Morrison appear to be decreasing their accruals per home sold one quarter, then drastically increasing accruals the next quarter to make up for it.
On the other hand, M.D.C. Holdings was much more volatile in the years leading up to the recession, but perhaps learned some hard lessons during that era, and has regulated its warranty accruals per unit sold since then. The company has been steady between $2,000 and $3,000 since 2018, and was between $1,000 and $2,000 from 2011 until 2017.
Shea Homes was acquired by a private investor back in 2014, after years of volatility, again showing the importance of regulating this key warranty metric.
The scale of Figure 7 is a bit smaller, and shows some success stories of mastering warranty accounting—and some failures.
Figure 7
Homebuilding Warranties:
Warranty Accruals Made per Unit Sold
(in U.S. dollars, 2003-2023)
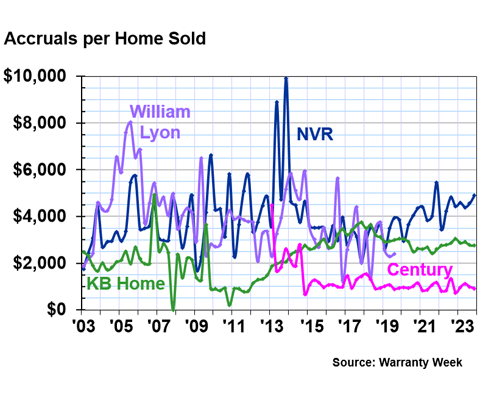
William Lyon was acquired by Taylor Morrison at the end of 2019, which is right around the time when warranty expenses really went off the rails for Taylor Morrison, as we saw in Figure 6.
NVR is up there with Taylor Morrison and Hovnanian in terms of companies that used to be really volatile with this warranty metric, and are still volatile, just a bit less so. NVR's accruals per home sold have ranged from about $3,500 to $5,500 in the past few years. While this isn't as bad as it was from the EKG chart from 2003 to 2014, it is still more volatile than average.
KB Home used to have a lot more volatility in this warranty metric leading up to the Great Recession, but has moderated since then. Accruals per home sold were increasing incrementally from 2011 to 2018 for KB, and have flattened out and remained steady for the past five years or so. Nowadays, KB generally accrues between $2,500 and $3,000 per home sold.
Century Communities is another company that had a lot of volatility in its warranty accounting in the beginning, but got things under control in an impressively short amount of time. Century's quarterly accruals per home sold are now usually between $700 and $1,300.
As we've seen, a range of about $1,000 or less we can consider steady, compared to the oscillations we've observed. It's less important how much each company is accruing per home sold; instead, we care more about the size of the range between these quarterly rates.
Figure 8 is really the family tree of one company, Lennar Corp., which acquired the others in the chart. Lennar sold the most homes of any of the 23 companies during the fourth quarter of 2023.
Figure 8
Homebuilding Warranties:
Warranty Accruals Made per Unit Sold
(in U.S. dollars, 2003-2023)
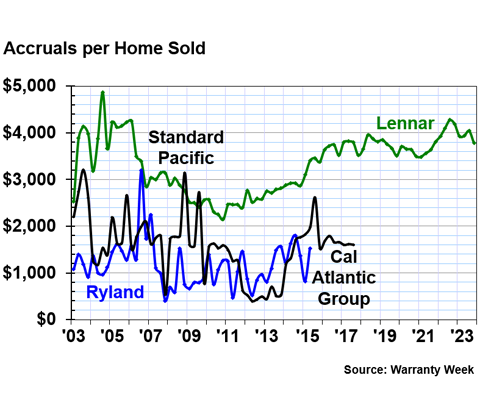
Standard Pacific Homes and Ryland Group Inc. merged in 2015 and changed their name to CalAtlantic Group. And then in 2018, Lennar acquired CalAtlantic.
Compared to those it acquired, Lennar's accruals per home sold have been quite steady in the past decade. Lennar has stayed in the range of about $3,500 to $4,500 per quarter, a little on the high side compared to the industry average, but steady nonetheless, and expected for higher-end luxury homes.
Lennar has succeeded where Taylor Morrison has struggled, and gotten the volatile warranty accruals of the company it acquired under control within a few years.
Figure 9
Homebuilding Warranties:
Warranty Accruals Made per Unit Sold
(in U.S. dollars, 2003-2023)
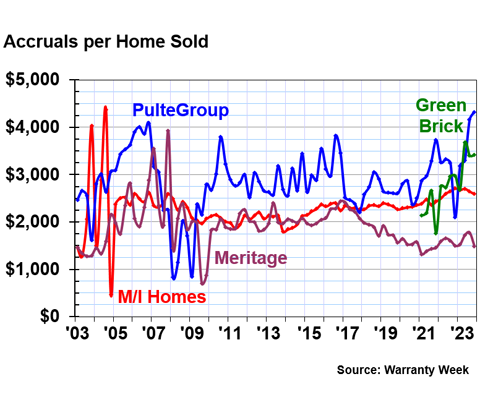
PulteGroup's range is from about $2,000 to $4,000 per home, which is a little larger of a range than usual. It's by no means the most volatile company in this report, but has definitely seen more oscillations in the past couple of years than we had come to expect from them. For instance, PulteGroup accrued $2,104 per home sold in the fourth quarter of 2022, and accrued $4,157 per home in the third quarter of 2023.
Meritage and M/I Homes are two companies that saw a lot of volatility before the Great Recession, but have regulated their warranty costs since then. M/I Homes is accruing right around the industry average of $2,500 per home each quarter, and Meritage is accruing around $1,500 per home per quarter, on the low side for the industry.
Green Brick is another newcomer, which started reporting in 2021. Its accruals per home sold have varied from $1,762 in the fourth quarter of 2021 on the low side, to $3,673 in the second quarter of 2023 on the high side.
Figure 10
Homebuilding Warranties:
Warranty Accruals Made per Unit Sold
(in U.S. dollars, 2003-2023)
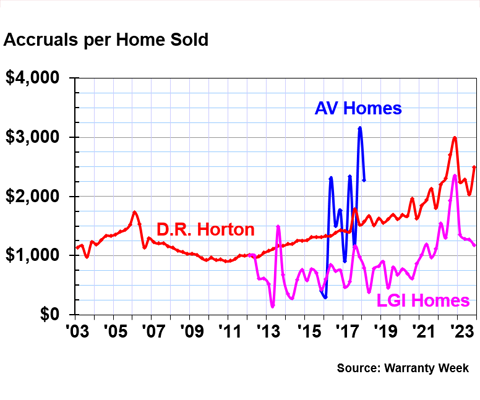
Finally, we have D.R. Horton, which jostles with Lennar for the most homes sold per quarter. D.R. Horton has seen a little more volatility than usual lately, but its quarterly accruals per home sold are still staying within a range of $1,000. The company set a new maximum in the fourth quarter of 2022, at $2,982 accrued per home sold. D.R. Horton has been increasing its accruals per home for about a decade at this point, first more incrementally, and now a bit more unpredictably.