
Twenty-first Annual Product Warranty Report:
Total warranty claims, accruals, and reserves increased among the U.S.-based manufacturers during 2023. Inflation has driven up the price of everything, including warranty work, but we see clear delineations among industry sectors. The vehicle and building trades sectors are seeing warranty costs grow, while the high tech sector is seeing a decline.
All but a small handful of late reporters have published their 2023 annual reports. In March, we presented the Top 100 Warranty Providers of 2023, and some information about the biggest increases and reductions in the warranty claims rates, accrual rates, and reserve balances among those largest manufacturers.
This week, we're presenting our Twenty-first Annual Product Warranty Report, based on the detailed warranty expense information we've been gathering since 2003. This year, we increased the number of companies included in this report, including many manufacturers that are new to reporting their warranty expenses. This year's report includes data from over 1,400 manufacturers that have reported product warranty expenses over the past two decades.
So we can state with some certainty that this newsletter provides the warranty expense data for every product warranty-issuing, U.S.-based manufacturer that is properly reporting its warranty expenses to investors and the U.S. Securities and Exchange Commission (SEC), as they are required by the Financial Accounting Standards Board (FASB)'s Accounting Standards Codification (ASC).
We make this distinction because there are some manufacturers in the United States that should be reporting their product warranty expenses, but have found legal and accounting loopholes, or are simply not in compliance, but have yet to be caught. Still, we have gathered all of the available data from the vast majority of manufacturers that are in compliance with SEC and FASB regulations, beginning in 2003 when these rules came into effect, all the way to the fourth quarter of 2023.
Since 2003, U.S.-based product warranty providers have been required to disclose the beginning and end balances of their warranty reserve funds, the amounts added to those funds in the form of warranty accruals, the amount paid from the funds in warranty claims, and any adjustments made to previous accruals for acquisitions, divestments, foreign exchange fluctuations, or changes of estimate. And since 2003, we've been collecting these data, and reporting them to our readers. This year, we're presenting 21 years of data, from 2003 to 2023, including the hundreds of new reporters we've discovered since last year's "Twentieth Annual Product Warranty Report."
Methodology
For all U.S.-based manufacturers that issue product warranties, we peruse their annual reports and quarterly financial statements, and gather three key warranty metrics: the amount of claims paid, the amount of accruals made, and the amount of warranty reserves held at the end of each financial period.
We also look for the best representation of a total for product revenue, either on the income statement or in the revenue segmentation footnotes, so we can calculate our two warranty expense rates: claims as a percentage of sales (the claims rate), and accruals as a percentage of sales (the accrual rate).
Based on its primary product line, each manufacturer in this report is assigned to one of three sectors: vehicles, electronics, or building trades. Within those sectors, they are each assigned to one and only one of 18 possible industry groups, such as Cars & Cycles, Trucks & Buses, Computers, Semiconductors, Appliances & HVAC, or Power Generation.
Our list of over 1,400 U.S.-based manufacturers that issue product warranties has been developed and cultivated over the past two decades. Every few years, we go back into the SEC database, and peruse the annual reports of all of the companies new to reporting, to see if we can find any warranty data. If we do find warranty expenses detailed in the most recent annual report, we add the manufacturer to our list of companies, and go back into all of their quarterly and annual reports filed with the SEC, and gather warranty data.
We conducted one such survey this year, and explored the annual reports of several hundred new reporters, in order to add about 200 new manufacturers to our list. This survey brought the total number of companies included this report up to 1,434. Of those manufacturers, 780 are no longer reporting their product warranty expenses, because they were either acquired, privatized, or went out of business. So this leaves us with about 650 manufacturers that reported product warranty costs during 2023.
One significant addition to our data this year is in the Computers industry. Back in 2013, Dell Inc. went private, and stopped reporting its warranty expenses. However, in 2016, Dell Inc. and EMC Corp. merged; although both entities were privately held at the time, the size of the merger meant that the newly-formed Dell Technologies Inc. needed to start publishing quarterly financial statements once again. Since the company remained private, this slipped our notice. Dell Technologies went public at the end of 2018, but we didn't gather these data until this year. So we've added in Dell's historical data, back to the beginning of 2015, to this report, and will go into detail on this in our upcoming industry report.
There's also a huge company that has departed from the Computers industry completely. Apple Inc. suddenly ceased reporting its warranty expenses in the third quarter of 2022. We've been reaching out for over a year, but Apple investor relations has yet to respond to our requests for comment. In last year's product warranty report, we fashioned estimates for the third and fourth quarters of 2022 based on the 2021 data. However, since it looks like Apple is done reporting its warranty costs for good, and comprised such a large percentage of nationwide product warranty expenses (about 5% of total claims and reserves, and about 4% of total accruals), we decided it wouldn't make sense to continue to fashion estimates from old data going forward. Thus Figures 2, 6, and 9 all show huge drops in warranty expenses from the computer industry from 2021 to 2022, and a further fall from 2022 to 2023.
We had to insert placeholder estimates for the warranty metrics of a handful of companies that were late to file their annual reports as of April 4, 2024, including Microvast Holdings Inc., Infinera Corp., SunPower Corp., 3D Systems Corp., Cutera Inc., Invacare Holdings Corp., Eargo Inc., and Escalade Inc. For some, such as SunPower, we only needed to fashion estimates for the fourth quarter of 2023, since they report their warranty expenses quarterly. For others, such as 3D Systems, we fashioned estimates for the whole fiscal 2023, since they only report their warranty expenses once a year in their annual reports.
In each case, when an estimate was required for either claims or accruals, we took an average of the metrics for each company from the four previous quarters. We carried over the most recent reported warranty reserve balance unchanged for most manufacturers. Estimates comprise less than 0.5% of the overall totals reported in this newsletter.
Vehicle Warranty Accruals
U.S.-based manufacturers set aside a total of $27.733 billion in warranty accruals during calendar 2023. That total is represented in Figures 1-3 across three industrial sectors.
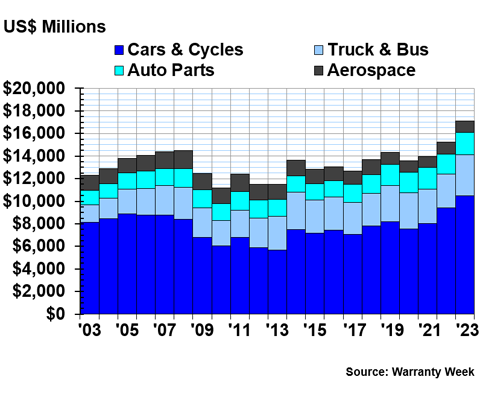
Figure 1 shows the total amount of warranty accruals made by the U.S.-based vehicle sector from 2003 to 2023. The vehicle sector is comprised of four industry groups: cars & cycles, which includes makers of passenger cars, motorcycles, boats, and other light-duty vehicles; trucks & buses, which includes makers of agricultural and construction equipment as well as heavy-duty trucks; auto parts suppliers; and aerospace.
Figure 1
Worldwide Warranty Accruals Made
by U.S.-based Vehicle Manufacturers
(accruals made in US$ millions, 2003-2023)
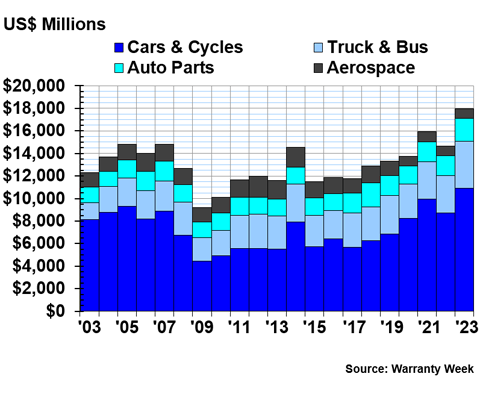
The vehicle sector accounted for 65% of all warranty accruals made by manufacturers based in the United States during 2023. This is the highest proportion of warranty expenses we've ever observed from the U.S.-based vehicle sector.
The vehicle sector accrued $17.972 billion for future warranty expenses during 2023. As we can see in Figure 1, this is by far the highest total we've seen from the vehicle sector.
On the industry level, both the cars & cycles and truck & bus categories set new records for total annual warranty accruals. The cars & cycles industry set aside a whopping $10.895 billion in warranty accruals during calendar 2023. This figure went up by $2.153 billion from 2022 to 2023, an increase of 25%. The truck & bus industry set aside $4.196 billion in warranty accruals during 2023, up by 27%, or $893 million, from 2022.
The auto parts industry accrued $2.009 billion during 2023, up 14%, or $251 million, from the year prior. It's the second-highest annual accrual total we've seen from the industry, exceeded by the figure from 2018.
Breaking the record-setting trend, the aerospace industry saw accruals increase by just $5 million, or 1%, to $871 million in 2023.
Electronics Warranty Accruals
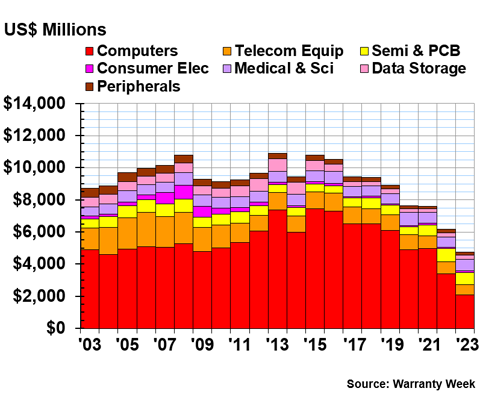
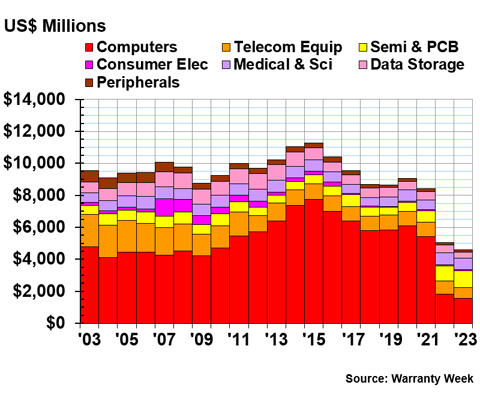
Figure 2 shows total annual warranty accruals for the high-tech electronics sector, which is comprised of seven industry groups: computers, telecommunications equipment, semiconductors & PCB, consumer electronics, medical & scientific equipment, data storage, and peripherals (e.g. printers).
Keep in mind that much of the computer industry's drop in Figure 2 can be explained by Apple ceasing to report its warranty expenses. However, the high tech sector's proportion of nationwide warranty expenses was already falling before Apple stopped reporting, mainly due to the shrinking of U.S.-based telecom and consumer electronics manufacturing.
Figure 2
Worldwide Warranty Accruals Made
by U.S.-based Electronics Manufacturers
(accruals made in US$ millions, 2003-2023)
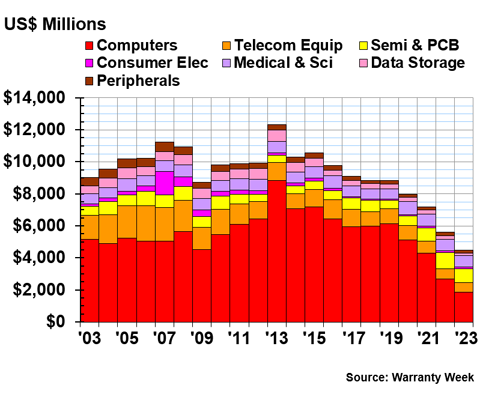
The high tech sector accrued a total of $1.599 billion for future warranty expenses during 2023.
The trends in the high tech sector are the foil to those of the vehicle sector. High tech's proportion of warranty expenses among U.S.-based manufacturers fell to just 16% in 2023, the lowest we've ever seen from the sector. While a large part of the explanation of this drop is Apple ceasing to report its warranty expenses, it's worth noting that six of the seven industries in this sector dropped their warranty accruals from 2022 to 2023.
The computer industry accrued a total of just $1.860 billion in 2023, the lowest we've ever seen from the industry by a huge margin. Apple's mid-year departure caused total warranty accruals in the computer industry to fall by -37%, or $1.599 billion, from 2021 to 2022, and its complete disappearance caused the total to fall by a further -31%, or $825 million, from 2022 to 2023.
Semiconductor manufacturers set aside $845 million in warranty accruals during 2023, down -16%, or $164 million, from 2022.
The medical & scientific equipment industry had the third-largest warranty accrual total in the high tech sector. It's still a recent phenomenon that warranty accruals for medical & scientific equipment manufacturers exceed those of telecom equipment manufacturers. In 2023, the medical & scientific industry accrued $719 million for future warranty expenses, while the telecom industry accrued $611 million.
The peripherals industry accrued $180 million during 2023, down -17%, or $37 million, from 2022. The data storage industry accrued $159 million, down -21%, or $42 million. And the consumer electronics industry accrued $107 million, up 8%, or $8 million.
Building Trade Warranty Accruals
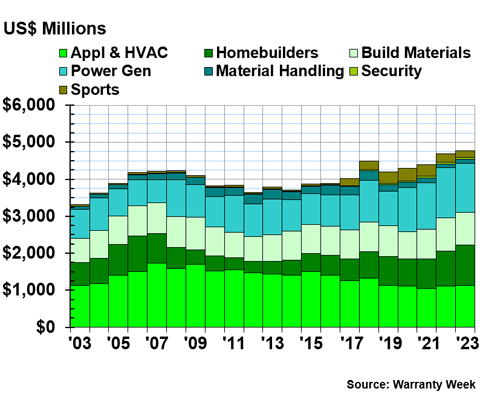
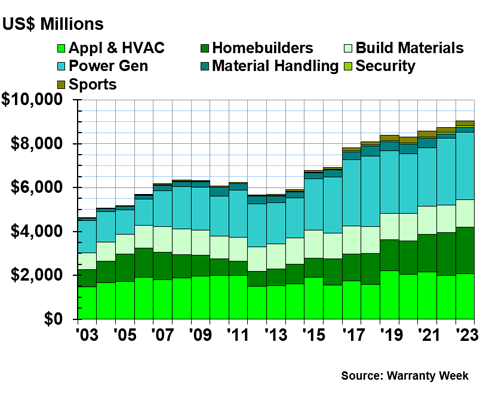
Figure 3 shows annual warranty accruals in the building trades sector. This sector is comprised of seven industries: appliances & HVAC, new home builders, building materials, power generation equipment, material handling, security, and sports.
The sports industry is the closest we come to an "other" category in this report, including the warranty expenses of diverse companies such as Philip Morris International Inc., which offers product warranties for its vape products, Peloton Interactive Inc., which makes luxury exercise equipment, Signet Jewelers Ltd., which owns the Jared and Kay jewelry brands, Agrify Corp., which makes equipment for indoor cannabis cultivation, Cricut Inc., which makes the eponymous stationery machines, and Yeti Holdings Inc., which makes coolers and insulated cups.
Figure 3
Worldwide Warranty Accruals Made
by U.S.-based Building Trade Manufacturers
(accruals made in US$ millions, 2003-2023)
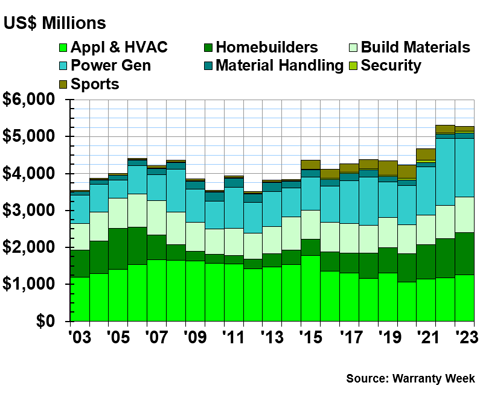
The building trades sector set aside a total of $5.282 billion in warranty accruals during calendar 2023.
Power generation equipment manufacturers set aside $1.573 billion during 2023, down -13%, or $235 million. The appliance & HVAC manufacturers set aside $1.265 billion, up 8%, or $90 million. The new home builders accrued $1.129 billion, up 7%, or $70 million. And the building materials manufacturers set aside $976 million, up 8%, or $69 million.
Material handling manufacturers accrued $148 million for future warranty expenses, up 38%, or $41 million, from 2022. The sports industry accrued $140 million, down -32%, or $65 million. And the security industry accrued $52 million, up 7%, or $3 million.
Warranty Expense Rates
The dollar amounts we've presented tell only part of the story. Warranty accruals are supposed to remain proportional to product sales, unless there's been a noticeable change in reliability or repair cost. Ideally, warranty claims costs will remain proportional to product sales as well. And because these are ratios, the impact of U.S. dollar inflation in the past few years should be minimized in Figure 4, as opposed to the totals in Figures 1-3 and 5-10.
Figure 4 shows the average claims and accrual rates among all of the product warranty-issuing manufacturers based in the United States, quarterly from 2003 to 2023.
Figure 4
All U.S.-based Companies
Average Warranty Claims & Accrual Rates
(as a % of product sales, 2003-2023)
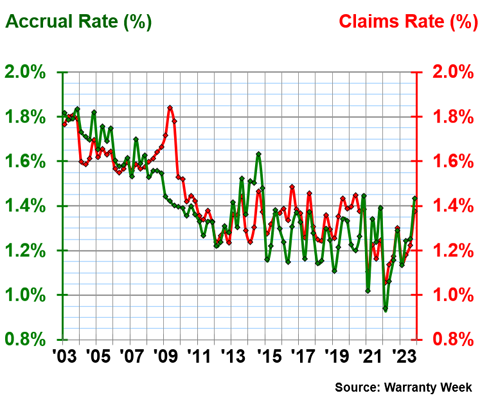
Over 21 years, the average claims rate was 1.43%, with a standard deviation of 0.18%, and the average accrual rate was 1.40%, with a standard deviation of 0.21%.
In 2023, the national average claims rate ranged from 1.15% in the first quarter, to 1.38% in the fourth quarter. The average accrual rate ranged from 1.13% in the first quarter, to 1.43% in the fourth quarter. 2023 was the third year in a row that we observed a sort of seasonal pattern to the average expense rates, lowest in the first quarter and highest in the fourth quarter.
Keep in mind that the standard deviation for the average accrual rate over 21 years was 0.18%. In 2023 alone, the difference between the highest and lowest average accrual rate was 0.30%. So we're still observing more volatility in this metric in the short-term than the average level of volatility over two decades. In short, the average warranty expense rates are getting more erratic.
Warranty Claims Totals
Manufacturers choose how much they set aside in warranty accruals, so we've highlighted that metric in this newsletter. But we'll briefly present and summarize total warranty claims and reserve end-balances for the three sectors.
During calendar 2023, U.S.-based manufacturers paid $26.598 billion in product warranty claims. Figure 5 depicts the 64% of those claims that were paid by manufacturers in the vehicle sector.
Figure 5
Worldwide Warranty Claims Paid
by U.S.-based Vehicle Manufacturers
(claims paid in US$ millions, 2003-2023)
The vehicle sector as a whole spent more on warranty claims during 2023 than we've ever seen before. Additionally, the cars & cycles, truck & bus, and auto parts industries all set new record highs for total warranty claims paid in a year.
The cars & cycles industry paid $10.508 billion in warranty claims during 2023, up 12%, or $1.084 billion. The truck & bus industry spent $3.586 billion in claims, up 21%, or $630 million. The auto parts manufacturers spent $1.996 billion on warranty claims, up 11%, or $190 million.
The aerospace industry was the only one in the vehicle sector to see warranty claims costs fall during 2023. Aerospace manufacturers paid $1.008 billion in claims, down -5%.
Figure 6 shows the claims payments of U.S.-based high tech manufacturers.
Figure 6
Worldwide Warranty Claims Paid
by U.S.-based Electronics Manufacturers
(claims paid in US$ millions, 2003-2023)
Just as we saw in Figure 2, the computer industry's warranty metrics have fallen significantly over the past two years, mainly due to Apple ceasing to report its warranty expenses. However, five of the seven industries in the high tech sector saw claims costs fall from 2022 to 2023, showing that the downward trend in high tech is beyond just the departure of one company, large though it is.
The computer industry paid $2.084 billion in claims during 2023, down -39%, or $1.325 billion, from 2022. The telecom industry paid $629 million in claims, down -13%. The semiconductor & PCB industry paid $761 million, down -8%.
The medical & scientific equipment industry saw warranty claims costs increase by 14% to $727 million during 2023.
Figure 7 shows warranty claims payments in the building trades sector.
Figure 7
Worldwide Warranty Claims Paid
by U.S.-based Building Trade Manufacturers
(claims paid in US$ millions, 2003-2023)
The building trades accounted for 18% of product warranty claims paid in the United States during 2023, a growing proportion of expenses among the three sectors.
The appliance & HVAC industry paid $1.131 billion in claims during 2023, up 2%. Building materials manufacturers paid $896 million in claims, up 0.5%. And the power generation industry paid $1.312 billion, down -3%.
The homebuilders break the trend of small, incremental changes in warranty claims costs in the building trades. The homebuilders saw claims costs rise by 13% in 2023, to a new record high of $1.083 billion. This is the first time the homebuilders have spent more than $1 billion on warranty claims in a calendar year.
Warranty Reserve Balances
We'll present one final metric, the collective end-balances of the warranty reserve funds of the over 1,400 manufacturers included in this report.
At the end of calendar 2023, all of the public, U.S.-based manufacturers that report their warranty expenses held a collective $55.159 billion in warranty reserves, up by 12% to a new record high.
Figure 8 shows the warranty reserves held by manufacturers in the vehicle sector. Vehicle manufacturers held 75% of U.S. product warranty reserves during 2023, a larger proportion than ever before.
Figure 8
Worldwide Warranty Reserves
Held by U.S.-based Vehicle Manufacturers
(reserves held in US$ millions, 2003-2023)
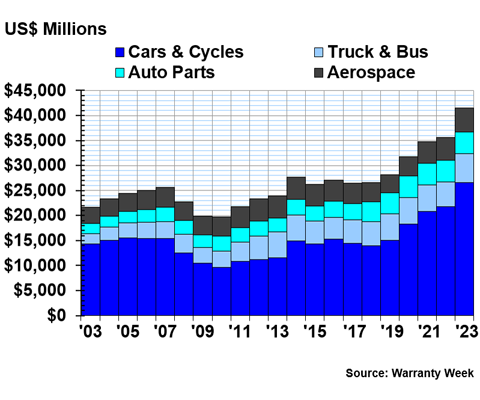
At the end of 2023, the car & cycle manufacturers held a combined $26.554 billion in warranty reserves, up 22%, or a whopping $4.786 billion. As we can see in Figure 8, this is by far the most we've ever seen manufacturers hold in reserves across this industry.
In fact, all four industries within the vehicle sector set new records for warranty reserve balances.
The truck & bus industry held $5.820 billion in warranty reserves at the end of 2023, up 17%, or $857 million. The auto parts manufacturers held a collective $4.351 billion in reserves, up 2%. The aerospace industry held $4.798 billion, up 4%.
Figure 9 shows warranty reserves held by manufacturers in the high tech sector.
Figure 9
Worldwide Warranty Reserves
Held by U.S.-based Electronics Manufacturers
(reserves held in US$ millions, 2003-2023)
The semiconductor & PCB industry's warranty reserves exceeded the billion-dollar threshold in 2023. Reserves grew by 7% from the end of 2022 to the end of 2023, to a total of $1.017 billion.
Since Apple didn't report the end-balance of its warranty reserve fund in its 2022 annual report, Apple's reserves disappear between 2021 and 2022 in Figure 9. The computer industry's reserves fell by two-thirds from 2021 to 2022, about $3.5 billion, just because of Apple ceasing to report.
The computer industry's warranty reserves shrunk by an additional -13% from 2022 to 2023, to a new record low of $1.564 billion.
The telecom equipment manufacturers' warranty reserves also hit a new minimum at the end of 2023, falling by -18% to $686 million. Reserves in the data storage industry hit a new low, at $397 million. Reserves among the peripherals manufacturers also fell, to a new minimum of $153 million.
The medical & scientific equipment manufacturers held $720 million in warranty reserves at the end of 2023. And the consumer electronics manufacturers held just $73 million in reserves at the end of calendar 2023.
Finally, Figure 10 shows the collective warranty reserves held at the end of each year for the manufacturers in the building trades.
Figure 10
Worldwide Warranty Reserves
Held by U.S.-based Building Trade Manufacturers
(reserves held in US$ millions, 2003-2023)
Warranty reserves among the homebuilders exceeded $2 billion for the first time, growing by 8% to a new total of $2.110 billion at the end of 2023.
The appliance & HVAC industry held $2.075 billion in reserves at the end of 2023. The power generation manufacturers held $3.079 billion in reserves. And the building materials manufacturers held $1.270 billion in warranty reserves at the end of 2023.
In the coming weeks, we will delve into the warranty costs of each industry depicted in this newsletter, beginning next week with an exploration of the precipitous rise in claims, accruals, and reserves among the car & cycle manufacturers.
SSN ANNOUNCES BEST OF WARRANTY & SERVICE CONTRACT INDUSTRY AWARDS
The warranty industry announces annual best-of-industry awards! Strategic Solutions Network (SSN) launches the inaugural SSN Warranty Industry Annual Awards for 2024. These awards are peer-nominated industry awards to recognize and showcase innovation and excellence in the warranty and extended warranty/service contract industries.
The inaugural 2024 awards features five awards categories with one winner per category. The awards will honor corporate entities with the exception of the "Warranty Industry Champion" award, which will recognize the most significant individual contributor to the industry.
AWARD CATEGORIES:
- Innovative Product Design
- Transformative Technology Innovation Leadership
- Customer Experience Excellence
- Operational Performance & Administrative Excellence
- Warranty Industry Champion
Please visit: www.warrantyawards.org for detailed criteria for each category and to submit your vote.
The 2024 Award nominees will be announced by end-August 2024, and winners will be announced on the first day of the 14th Annual Extended Warranty and Service Contracts Innovations conference, scheduled for September 24-25, 2024, at the Palmer House Hilton, Chicago, Illinois.
The awards steering committee will oversee the voting process to ensure fairness and transparency:
- Eric Arnum, Publisher, Warranty Week
- Travis Moore, General Counsel, Service Contract Industry Council (SCIC)
- Roz Applebaum, Vice President, Warranty Innovations Conferences, SSN
Please visit www.warrantyawards.org for more detailed information and to submit your nominees. To vote, visit www.warrantyawards.org/vote.php.
Strategic Solutions Network (SSN) is also the producer of highly acclaimed industry-wide events including:
- The 14th Annual Extended Warranty & Service Contract Innovations, September 24-25, 2024, Palmer House Hilton, Chicago, Illinois. www.warrantyinnovations.com
- The 3rd Annual Warranty & Service Contracts for Vehicle, Home, Smart Products & Consumer Goods, scheduled for Spring, 2025. www.globalwarrantyinnovations.com
For more information, contact: Roz Applebaum at roz@strategicsolutionsnet.com.