We are very pleased to begin our series of twenty-year charts with this product warranty report. March is the month that most U.S.-based manufacturers release their annual reports, so it's also the time of year that we traditionally publish a tally of all of the claims, accruals, and warranty reserves detailed in those financial statements. We will start off the series with a high-level snapshot of the totals and averages. In the coming weeks, we will go deeper into specific industries and examine the warranty metrics of specific companies.
Warranty Week celebrated its twentieth anniversary of publication last November. So this week, rather than looking at the five-year data, as we typically do in this report, we present this culmination of twenty years of warranty data collection and analysis. Expect many more twenty-year charts to come.
Warranty Week was born in the wake of the Enron scandal, which prompted stricter financial reporting regulations for all companies publicly trading in the United States. Since 2003, all public companies that use the accrual method have been required to disclose the size of their warranty expense accounts. According to the rules of the Financial Accounting Standards Board's FASB Interpretation Number 45 (FIN 45), and later under Accounting Standards Codification 460 Guarantees (ASC 460), specifically ASC 460-10-50-8c, product warranty providers are required to disclose the beginning and ending balances in their warranty reserve funds, the amounts added to them as accruals, the amounts paid from them in claims, and any adjustments made for acquisitions, divestments, foreign exchange fluctuations, or changes of estimate. We have been collecting these data for as long as they have been reported.
Methodology
For all U.S.-based manufacturers that issue product warranties, we look in the footnotes of their annual reports and quarterly financial statements for three key warranty metrics: the amount of claims paid, the amount of accruals made, and the amount of warranty reserves held at the end of each financial period. Usually, they're all buried in a table under "contingencies" or "liabilities" somewhere near the end of the reports. Most report these data quarterly, but a few choose to report annually instead.
We also look for the best representation of a total for product revenue, either on the income statement or in the revenue segmentation footnotes, so we can calculate our expense rates: claims as a percentage of sales (the claims rate) and accruals as a percentage of sales (the accrual rate). These ratios represent the changing relationship between warranty expenses and product sales.
Based on the company's product line, each manufacturer in this report is assigned to one of three sectors: vehicles, electronics, or building trades. Within those sectors, they are assigned to one (and only one) of 18 possible industry groups, such as cars, trucks, computers, semiconductors, appliances, new homes, or power generation. The goal is to allow us to compare and contrast the rises and falls in the totals and averages of these warranty metrics.
We had to insert placeholder estimates for the warranty metrics of five companies that report their warranty expenses only once a year, in their annual reports, and have yet to file those reports as of close of business on March 15, 2023. Those five companies are: 3D Systems Corp., Crawford United Corp., FreightCar America Inc., inTest Corp., and Rubicon Technology Inc. These placeholder estimates added $17.7 million to the 2022 claims total, and $17.4 million to the 2022 accrual total. And, we estimate, these companies together held $12.0 million in their warranty reserves at the end of 2022.
And then we had to insert placeholder estimates for the fourth quarter of 2022 for 26 companies that have filed their quarterly financial reports for the first, second, and third calendar quarters of 2022, but have yet to file an annual report as of close of business on March 15, 2023. These additional placeholder estimates added $50.2 million to the 2022 claims total and $45.0 million to the 2022 accrual total. Their warranty reserves, which were measured at $231.6 million as of September 30, 2022, were carried over unchanged to the year-end total.
In each case, when an estimate was required for either claims or accruals, we took an average of the readings for each company in the four previous quarters. In the next few weeks, we will replace these estimates with the actual numbers as they become available.
The late filers for which we created estimates comprise about 0.3% of both the claims and accruals totals, and about 0.5% of the reserves total for 2022. So the data represented here are all over 99.5% verbatim.
A few companies left the index in 2022 due to mergers, acquisitions, or going private. These include powertrain company Meritor Inc., which was acquired by Cummins Inc. last year; Plantronics Inc., acquired by HP Inc.; Natus Medical Inc., acquired by private equity firm ArchiMed; and restaurant equipment company Welbilt Inc., acquired by Italian company Ali Holding SRL.
In addition, the biggest change to the data this year is that Apple Inc. stopped reporting its warranty data in the third quarter of 2022, contrary to the requirements of ASC 460. Unlike the other companies for which we crafted estimates, Apple has already released its 2022 annual report. The company did not respond to our requests for comment. Apple alone accounts for 5.2% of the claims, 3.9% of the accruals, and 5.1% of the reserves in this report. All of Apple is in the Computer category (Fig. 2, 6, and 9), and all of its data for the third and fourth quarters of 2022 are estimates.
Vehicle Warranty Accruals
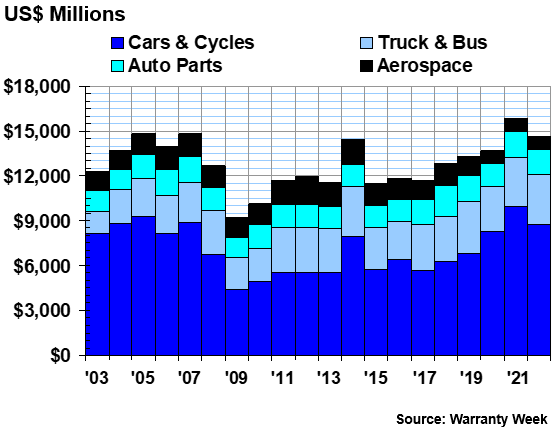
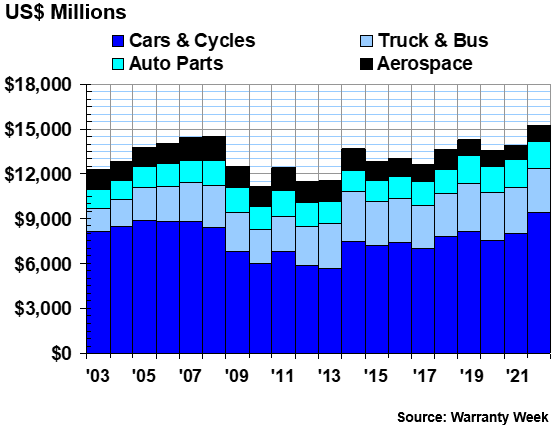
In Figure 1, we're looking at the total amount of warranty accruals made by the U.S.-based vehicle sector for the past twenty years. The vehicle sector is comprised of four industries: cars & cycles, trucks & buses, parts suppliers, and aerospace.
Figure 1
Worldwide Warranty Accruals Made
by U.S.-based Vehicle Makers
(accruals made in US$ millions, 2003-2022)
Vehicle warranty accruals accounted for 59% of the total accruals made in 2022, a total of $14.64 billion for the year. This was actually slightly down from the record-setting total of 2021, $15.86 billion.
In particular, the car & cycle industry saw a -12% reduction in accruals from 2021 to 2022. As we saw in our recent report on the nine-month data for 2022, this is mainly a recovery from heightened accruals due to troubles faced by General Motors Co. and Ford Motor Co. in the past few years, from product recalls to global supply chain issues.
While 2021 was a record-setting year for warranty accruals in the automotive industry, we see in this twenty-year chart that total accruals have approached $15 billion a few times before, particularly in 2005, 2007, and 2014. These are the only three years prior to 2021 that saw total accruals exceed $14 billion. Overall, it looks like accruals in this industry took about a decade to recover after the Great Recession, with the exception of 2014, which was a year of huge recalls for GM.
It is notable that the share of accruals made by the aerospace industry has decreased rather significantly in the past decade. For example, we measured $1.87 billion in total accruals for this industry in 2012, but only $859 million in 2022. The biggest decrease was between 2019 and 2020, perhaps explainable by the pandemic. But accruals have barely risen in the two years since 2020, even decreasing -3.4% in the last year.
The average across the three sectors was a decrease of -4.5% in warranty accruals. Compared to this, cars & cycles fell faster, decreasing their accruals by -12%. For the vehicle sector, accruals were down by -7.7% in 2022. Aerospace decreased by -3.4%, falling but not as much as the national average. Trucks & buses were rather consistent, increasing accruals by just 1.1%, and auto parts were even more steadfast, increasing by only 0.4%.
Electronics Accruals
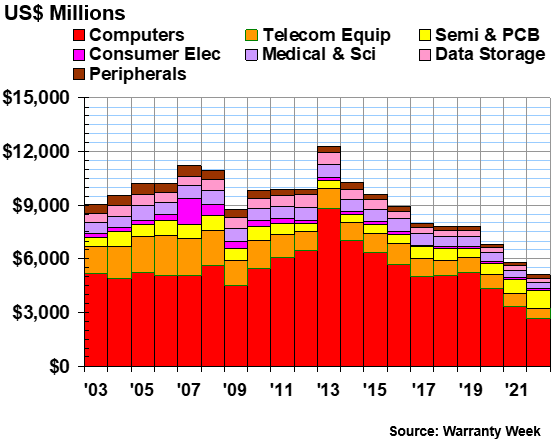
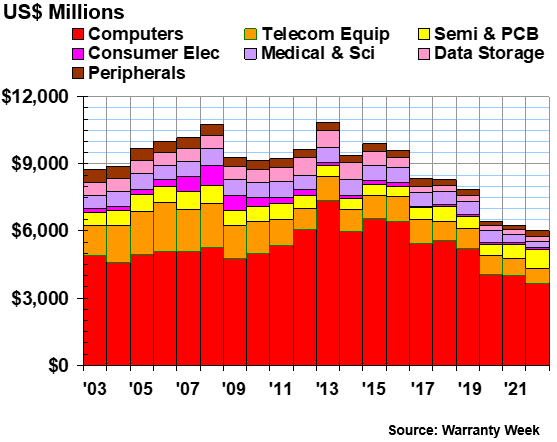
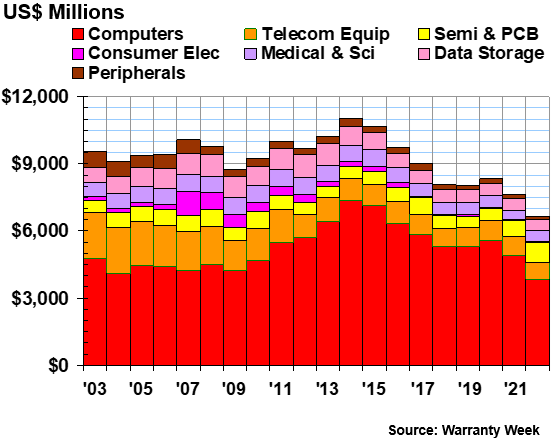
In Figure 2, we're looking at the high-tech electronics sector, and the seven industry categories that fit within it: computers, telecommunications equipment, semiconductors & PCBs, consumer electronics, medical & scientific equipment, data storage, and peripherals.
The largest by far is the computer industry, which is the home of HP, IBM, as well as Apple.
Figure 2
Worldwide Warranty Accruals Made
by U.S.-based Electronics Manufacturers
(accruals made in US$ millions, 2003-2022)
Overall, total accruals for this sector have sharply decreased in the wake of the pandemic, though things have been trending downwards for just about the whole last decade. Some of that decline was due to mergers with and acquisitions by non-U.S. companies; some was caused by companies unilaterally deciding to stop revealing their warranty expenses to investors; and some was part of a long-term secular decline in this sector of the U.S. manufacturing landscape.
In 2022, accruals in the electronics sector were down by -12% to $5.09 billion. The steepest drops were in data storage (-21%), computers (-20%), and telecom equipment (-18%). Medical & scientific equipment was also down by -13%. Consumer electronics was rather consistent, with accruals rising slightly by 2.6%. Accruals increased notably for peripherals, which rose by 20%, and semiconductors & PCB, which rose by 22%.
Accruals in the Building Trades
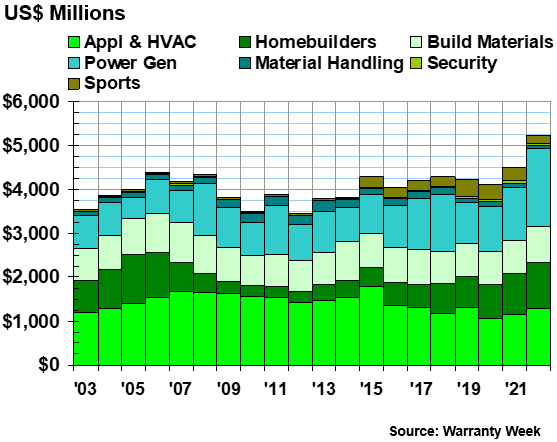
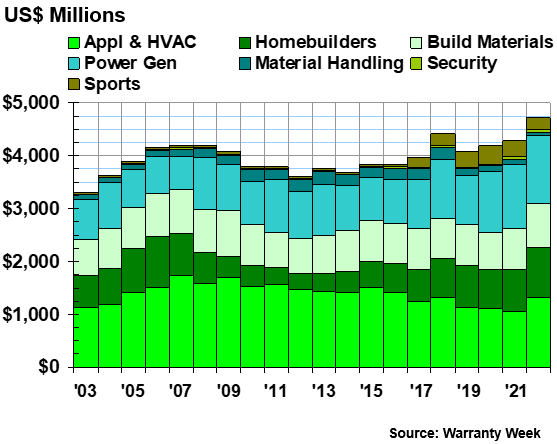
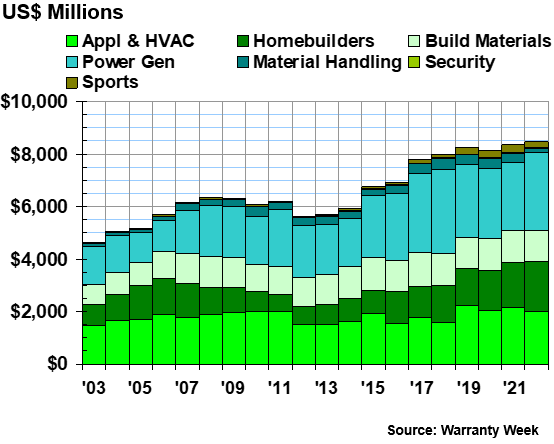
In Figure 3, we're looking at warranty accruals in the building trades. Perhaps unsurprisingly, it looks to be the most predictable and least disorderly of the three sectors, though a few of the individual industries have shown interesting trends over the past two decades.
We note that the "Sports" industry included in this sector encompasses a few of the companies that were a little more difficult to categorize. They are united by their relationship to recreation, luxury, and leisure. For example, this category includes the tobacco company Philip Morris International Inc., which now offers warranties for its vape products; Peloton Interactive Inc., which makes high-end exercise equipment; Fossil Group Inc., which makes watches, accessories, and apparel; Cricut Inc., with which scrapbooking and crafting enthusiasts will be familiar; and Agrify Corp., which develops equipment and software for indoor cannabis cultivation.
Figure 3
Worldwide Warranty Accruals Made
by U.S.-based Building Trade Companies
(accruals made in US$ millions, 2003-2022)
Overall, accruals in the building trade sector were up by 16% to $5.23 billion in 2022. This is remarkable, representing a significant new record high for this sector, and the first time accruals in this sector have exceeded $5 billion.
In particular, accruals were up a whopping 45% for the power generation industry. This figure reflects the observations we made in last week's Wind Turbine Warranty Report, which showed that warranty claims and accruals have been increasing for the global wind power industry. As the United States focuses more on ramping up renewable energy production, these accruals will likely continue to increase. With rapid innovation and expansion naturally comes more product failures, and more money being set aside for future claims in this industry as a whole. Power was actually the largest industry in the building trade sector, surpassing appliances & HVAC. $1.76 billion was set aside for accruals in the U.S.-based power generation industry in 2022.
We also see more modest increases in accruals for appliances & HVAC (+13%), new home builders (+12%), and building materials (+10%). The new home builders are almost back to their pre-Great Recession accrual figures after a notably slow recovery, as we observed in our recent Nine-Month New Home Warranty Report. Total accruals for the home builders were $1.04 billion in 2022, exceeding $1 billion for the first time since 2006.
On the other hand, accruals were down by -15% for the material handling industry, and -33% for the sports industry. Accruals for the sports industry grew significantly between 2014 and 2015, and peaked in 2019, right before the pandemic hit, and are still higher than historical numbers despite this drop.
The biggest decrease of them all was the security industry, down -45%. Security is actually the smallest of the 18 industries in this report, and includes makers of weapons and security systems. This looks to be a correction from abnormally high accruals in 2021.
Warranty Expense Rates
The dollar amounts in and of themselves tell only part of the story. Warranty accruals are supposed to remain proportional to product sales, unless there's been a noticeable change in reliability or repair cost (maybe a global supply chain crisis). That ratio between sales and expenses can go up or down, resulting in changes in the accrual rate.
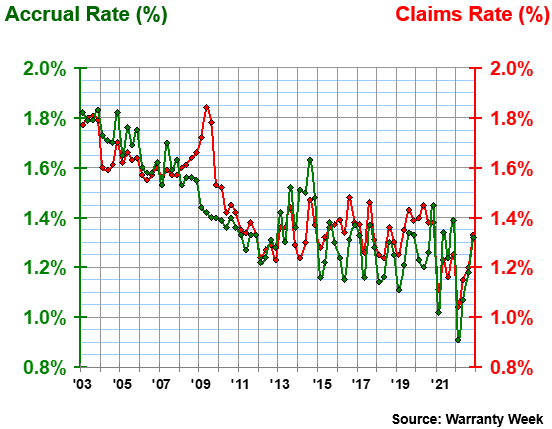
Figure 4 below shows the two expense rates, the accrual rate and the claims rate, over the past twenty years. This shows us claims and accruals relative to sales, aiding us in conceptualizing the warranty expenses of the entirety of U.S.-based manufacturing relative to total product revenue.
Figure 4
All U.S.-based Companies
Average Warranty Claims & Accrual Rates
(as a % of product sales, 2003-2022)
We saw significant anomalies in the expense rates in the first quarter of 2022. In that quarter the accrual rate fell to 0.91%, the first and only time this number has fallen below 1%. The claims rate of 1.04% measured at the same time was another record low.
Expenses rebounded during the year; the claims rate rose to 1.33% and the accrual rate rose to 1.32% by the fourth quarter of 2022. These figures are closer to the average rates over twenty years. The average claims rate from 2003 to 2022 was 1.44% with a standard deviation of 0.18%, and the average accrual rate was 1.41%, with a standard deviation of 0.21%.
It is really significant and strange that both expense rates varied more in the past year than they varied on average over the past twenty years, as reflected by the standard deviations. From the first to the fourth quarter of 2022, the accrual rate rose by just about twice its standard deviation, and the claims rate rose by a little more than its standard deviation. This is a level of anomaly that is unprecedented for these metrics, as we can observe visually in Figure 4 in the zig-zag of what should be a fairly smooth trend line, especially in recent years.
We noticed a similar pattern in 2021, with the expense rates in first quarter also coming in abnormally low, but back to normal by the end of the year. Overall, it seems like the data in Figure 4 can be divided into two halves: steady improvements from 2003 to 2011 (except for the recessionary spike in the claims rate in 2009), followed by noisy oscillations from 2012 to 2021. Another way of looking at it is that the numbers in the left half are above the twenty-year average, and those on the right half are below average.
To say the least, we are puzzled by these ever-bigger peaks and troughs showing up in this chart. The best guess we can come up with is that some manufacturers are getting into the habit of artificially boosting their accruals late in the year and cutting them artificially early in the next. Of course, we acknowledge that the world has been extra unpredictable in recent years, but it seems like this improvisation is becoming more popular and common. Theoretically, a company should accrue the same amount of money for every unit of the same product. Perhaps some of the accountants are not aware that this publication is observing their moves.
Warranty Claims Totals
While total accruals fell in 2022, total claims rose by 6.3%. This is a big upturn after three years of claims decreases, especially in 2020. Total claims paid across the three sectors in 2022 was $25.93 billion, actually exceeding the accruals total.
Total claims paid reached record highs in 2022 for the vehicle and building trade sectors, but this was offset by the record low claims total we recorded for the electronics sector. Figure 5 shows the vehicles sector, the first of the two record-breakers.
Figure 5
Worldwide Warranty Claims Paid
by U.S.-based Vehicle Makers
(claims paid in US$ millions, 2003-2022)
In the vehicles sector overall, claims were up 9.7% to a record $15.22 billion. This is the first time the claims total has exceeded $15 billion for this sector. Notably, accruals spiked in 2021 for this sector, and remained high in 2022; clearly, these extra claims were expected.
Claims were up 17% for the cars & cycles industry, setting a record high of $9.43 billion in claims paid in 2022. Claims were also up by 14% for the aerospace industry, but this does not reflect a high, but rather a return to normal after a lower-than-usual claims total in 2021. Claims for the auto parts industry fell by -6%. The truck & bus industry saw claims fall by a modest -1.7%.
On the other hand, warranty claims totals fell to an all-time low for the electronics sector of U.S.-based manufacturing, shown in Figure 6.
Figure 6
Worldwide Warranty Claims Paid
by U.S.-based Electronics Manufacturers
(claims paid in US$ millions, 2003-2022)
In the electronics sector overall, claims were down -3.9% to just about $6 billion. While that figure is nothing to scoff at, this is almost half the sector's high of $10.86 billion, recorded in 2013. As we saw in Figure 2, total accruals for this sector, and specifically for the computers industry, have fallen significantly over the past decade as well.
The biggest drop was in the medical & scientific equipment industry, which saw claims fall by -16%. Claims for the telecommunications equipment industry fell by -10%. Computers, by far the largest category, saw a drop of -8.6% in total claims.
Interestingly, some of the smaller industries under the category of the electronics sector did actually see big growth in total claims paid. Claims paid rose by 26% in the peripherals industry, by 22% in the semiconductor & PCB industry, and by 21% in data storage. Consumer electronics claims stayed just about the same, rising by just 0.5%.
As shown in Figure 7, total claims paid in the building trade sector rose to a record high in 2022, with help from big growth in claims from the new home builders, appliances & HVAC, and the renewable energy companies in the power generation industry.
Figure 7
Worldwide Warranty Claims Paid
by U.S.-based Building Trade Companies
(claims paid in US$ millions, 2003-2022)
Total claims paid rose by 10% in the building trade sector to $4.71 billion in 2022. Under this umbrella, the biggest growth in total warranty claims was in the appliance & HVAC industry, which rose 25% in 2022, followed by the new home builders, which rose by 20%. Claims for the building materials industry rose by a more modest 8%, and by 5% for the power generation industry. Power generation continues to take on a growing share of the total claims for the building trades sector, mainly due to the renewable energy manufacturers and installers.
Total claims for materials handling were down by -28%, the lowest-ever claims total we have measured for this industry. Claims for the security industry were down -18%, but this reflects the second-highest total for the industry, a decrease only because the year prior was record-setting. Similarly, claims were down -26% for the sports industry, but still much higher than any of the totals recorded before 2018.
Overall, these numbers show that the composition of companies in the United States' building trade sector is changing, with power generation, security, and sports taking on an increasing market share, while material handling wanes.
Warranty Reserve Balances
Finally, we have one more metric to detail: the ending balance in the combined warranty reserve funds of the hundreds of manufacturers that we track. Whereas we would normally compile all of the totals for the 18 industries across the three sectors into one chart, some intriguing trends emerge from looking at the reserves balances divided by sector.
The warranty reserve balances provide compelling evidence for the three overarching sector-wide trends we have observed in this article: the vehicle makers and building trades continue to increase, while the electronics sector shrinks to record lows.
In 2003, when we first started collecting these data, warranty reserves across the three sectors totaled $35.86 billion, with vehicles comprising 60% of that total, electronics comprising 27%, and buildings 13%. In 2022, total warranty reserves reached a record $51.66 billion, with vehicles accounting for 71%, electronics just 13%, and buildings 16%.
To put this into context: in 2003, vehicles received 51% of claims, electronics 36%, and buildings 14%. In 2022, vehicles had 59% of claims, electronics had 23%, and buildings had 18%. The proportions for accruals are very similar.
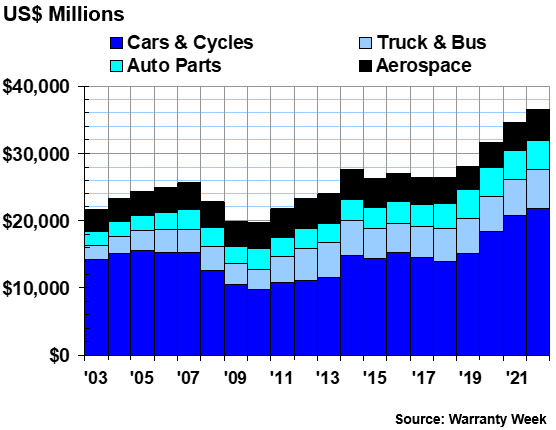
Figure 8 shows the total warranty reserves held in the vehicle sector.
Figure 8
Worldwide Warranty Reserves
Held by U.S.-based Vehicle Makers
(reserves held in US$ millions, 2003-2022)
Amazingly, all four industries in the vehicle sector set record highs in their warranty reserve balances in 2022, reflecting the sector's growing majority share of the total nationwide warranty reserves, claims, and accruals. The most dramatic increase has been that of the cars & cycles industry, which has seen totals rise around 50% in the past five years, and almost doubled in the past decade. The 2022 reserve total for this industry was $21.89 billion, the largest of the 18 industries by far.
Figure 9 reflects the fact that the proportion of total reserves represented by the electronics industry has fallen in half over the past two decades.
Figure 9
Worldwide Warranty Reserves
Held by U.S.-based Electronics Manufacturers
(reserves held in US$ millions, 2003-2022)
We see that the biggest shrinkages in reserves over the past twenty years have been in telecom equipment, consumer electronics, medical & scientific equipment, data storage, and peripherals.
The biggest decline in reserves from 2021 to 2022 was in the computer industry, which saw a -22% decrease in total reserve balances. This industry's warranty reserves reached an all-time low, with balances totaling $3.83 billion. This is the first time we have recorded this industry's total reserves under $4 billion since we started collecting these data. Of course, this is complicated by the fact that Apple, the largest company in the industry, stopped reporting its warranty data halfway into the year.
The biggest increase in reserves was in the semiconductors & PCBs industry, which saw balances rise by 28%. This industry reached an all-time high in 2022, with reserves totaling $914 million. This industry also had compelling growth in claims and accruals totals last year. As we said, changing faces in the electronics sector in the United States.
Figure 10 shows the warranty reserve totals for the building trades sector.
Figure 10
Worldwide Warranty Reserves
Held by U.S.-based Building Trade Companies
(reserves held in US$ millions, 2003-2022)
Total reserves for the builders continue to increase, especially due to the growing reserves for the burgeoning power generation industry, including renewable energy. Reserves for this industry increased by 17% in 2022. Reserves for the new home builders also went up, reflecting the housing boom of the pandemic.
Reserves for every other industry in this sector actually decreased, despite the overall upward trend. The biggest decline was -67% decrease in reserves for the material handling industry.
Looking at the reserve balances is particularly helpful this year due to the fluctuations that we noted in the accruals and claims data. These data tell a compelling story about the evolution of American manufacturing. Over the coming weeks, we will dive deeper into some of these industries, and see not just how the biggest companies have recovered from the pandemic, but also how their warranty metrics have changed over the past two decades that we have been rounding up these data. This report truly has been twenty years in the making.