Recreational Vehicle Warranty Expenses:
The warranty expenses of RVs, boats, and motorcycles often get buried under other larger aspects of the vehicle sector. In 2023, RV and boat warranty claims are up and accruals are down after the pandemic sales boom, while motorcycle claims are down and accruals are up.
We discuss vehicle warranties frequently at Warranty Week. In our most recent edition of the newsletter, we discussed the warranty expenses of the global heavy equipment industry. We discussed the third quarter warranty expense data for the U.S.-based passenger car OEMs the week before that, and the warranty expenses of all of the global car OEMs over the summer, the culmination of a two-month series about regional car warranties. We analyzed airplane warranty expenses in September. While vehicle warranties are not all we cover, they account for more than half of all warranty expenses worldwide, and are certainly a huge part of our dataset.
So, this year, we've analyzed the warranty expenses of internal combustion and electric cars, trucks, heavy equipment, powertrain, aircraft, and jet engines. As the year winds down, we endeavor to ensure that we were thorough in our presentation of the available warranty data. This week, we are delving into the warranty expenses of smaller industries that fall under the umbrella of vehicles: RVs, boats, and motorcycles. For this newsletter, we're limiting our scope to manufacturers based in the United States, so we can present data up to the most recent available quarter, the third quarter of 2023.
RVs, short for recreational vehicles, can be bus-like motorhomes, or tow-able trailers. Over the past decade, the average age of RV owners has decreased, and RV ownership in the United States has increased by about 25%. To keep the focus of the newsletter on recreation, we distinguished RVs from trailer homes that remain on the same lot, and thus eliminated mobile home manufacturers such as Skyline Champion, which is primarily a homebuilder rather than a vehicle OEM. Sure, there are people who live full-time in RVs, either mobile or in one place. But the majority are used not out of necessity, but for leisure, and are not primary vehicles, similar to boats and motorcycles.
We identified four U.S.-based RV manufacturers that trade publicly and report their warranty expense data: Thor Industries Inc., which owns the Airstream brand; Winnebago Industries Inc.; Rev Group Inc., which manufactures RVs, fire trucks, ambulances, school buses, and street sweepers under a plethora of brands; and Shyft Group Inc., which owns the Spartan RV Chassis brand.
Next, we found three U.S.-based boat manufacturers that report their warranty expenses: Malibu Boats Inc., which makes speedboats and "watersports towboats" used for water skiing and wakeboarding; MasterCraft Boat Holdings Inc., which also makes towboats for water sports, as well as speed boats, fishing boats, and pontoons; and Marine Products Corp., maker of sports boats, fishing boats, and other pleasure boats.
Finally, we identified two U.S.-based motorcycle manufacturers. The first is Harley-Davidson Inc., the iconic motorcycle brand with global name recognition. And the second is Polaris Inc., which has a large presence in the motorcycle industry with its Indian Motorcycle subsidiary. Polaris also makes snowmobiles and ATVs, and is a defense contractor that designs and produces off-road armored vehicles. We did a bit of research to see if we could report on ATV warranties as well, but the top brands are mostly owned by larger vehicle manufacturers, such as Textron and Bombardier, along with Japanese manufacturers that also have a large presence in global motorcycle manufacturing, such as Honda, Suzuki, Kawasaki, and Yamaha.
For each of these nine companies, we perused their quarterly and annual financial reports, and extracted three key warranty metrics: the amount of claims paid, the amount of accruals made, and the end-balance of the warranty reserve fund. In addition, we collected quarterly data on product sales revenue, which we used to calculate our two additional warranty expense rates: claims as a percentage of sales (the claims rate) and accruals as a percentage of sales (the accrual rate). Since we use product revenue, meaning only the revenue generated from the sale of a product that comes with a warranty, and not total revenue, we eliminate income from things such as extended service contracts and Harley-Davidson T-shirts.
All of these charts include the most recent data available, up to the third quarter of 2023. First, let's take a look at the warranty costs in the RV industry.
RV Warranties
Figure 1 shows the total warranty claims payments of our four U.S.-based RV manufacturers over the past ten years.
Figure 1
RV Warranties:
Claims Paid by Top U.S.-based Manufacturers
(in US$ millions, 2014-2023)
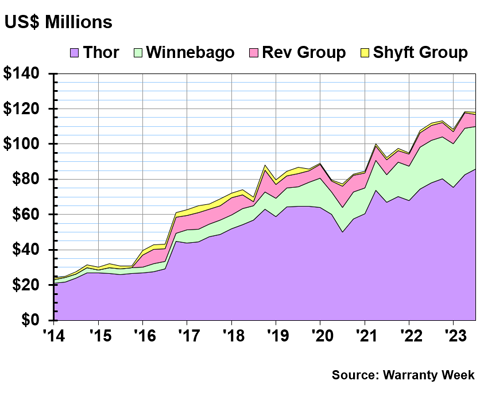
First, we clearly notice that total RV warranty expenses have increased significantly over the decade. Part of that story is, as ever, inflation. But another big part of this is that RVs specifically have become more popular, after a wane in appeal in the 2000s. The industry capitalized on the "van life" trend to boost sales, and the pandemic made them an all the more appealing way to travel.
Thor, the largest of the four companies, paid $85.7 million in claims during the third quarter of 2023, up a bit from the second quarter. This was actually the highest quarterly claims total we've ever seen from Thor. But not necessarily cause for alarm, since this is a combination of problems emerging from RVs purchased during the industry's boom in 2021, and inflation raising the cost of parts and labor across the entire vehicle sector.
Winnebago, the next-largest in the U.S.-based industry, paid $24.1 million in claims during the third quarter of 2023, down a bit compared to the same quarter the year prior. Rev Group paid $7.1 million in claims in the third quarter, down -14% compared the third quarter of 2022. And Shyft Group paid $1.1 million, also down compared to the third quarter of 2022.
Next, we'll take a look at these four companies' total warranty accruals over the past decade in Figure 2.
Figure 2
RV Warranties:
Accruals Made by Top U.S.-based Manufacturers
(in US$ millions, 2014-2023)
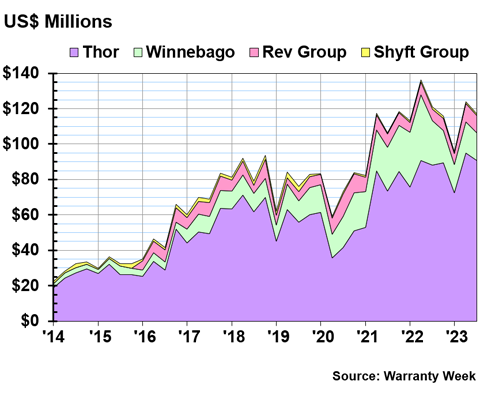
Thor's accruals totaled $90.8 million in the third quarter of 2023, up a little compared to the same quarter in 2022. Thor accrued a personal record high of $94.97 million in the second quarter of 2023. As we'll see in Figures 3 and 4, the company's warranty expense rates have been up over the past year as well.
Winnebago accrued $15.4 million in the third quarter of this year, down almost -40% compared to the same quarter in 2022. Mid-2022 seemed to be an outlier high for Winnebago's warranty accruals.
Rev Group accrued $9.7 million in the third quarter of 2023, while Shyft Group accrued $1.02 million.
In Figure 3, we'll look at the claims totals from Figure 1 divided by product revenue, to produce the warranty claims rates.
Figure 3
RV Warranties:
Claims Rates for Top U.S.-based Manufacturers
(as % of product revenue, 2014-2023)
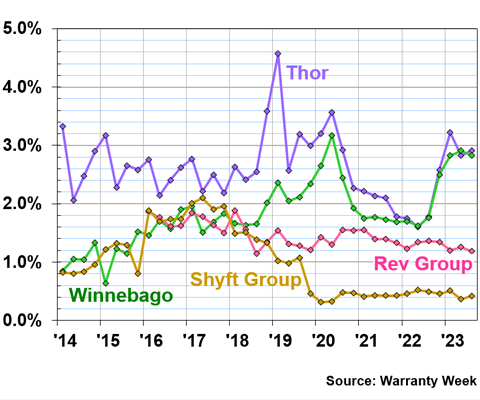
We can see that Thor and Winnebago both saw their claims rates fall in 2021 and early 2022, when RV sales boomed in the United States. Since then, the claims rates for both have risen, Thor to the high middle of its historic range over the decade, and Winnebago to the very top of its range, almost exceeding it. Thor's claims rate in the third quarter of 2023 was 2.9%, and Winnebago's claims rate was 2.8%.
Our two smaller RV manufacturers have been paying a very consistent portion of their product revenues in claims over the past few years. In the third quarter of 2023, Rev Group's claims rate was 1.2%, and Shyft Group's claims rate was 0.4%.
Next, we'll look at the four companies' accrual rates in Figure 4.
Figure 4
RV Warranties:
Accrual Rates for Top U.S.-based Manufacturers
(as % of product revenue, 2014-2023)
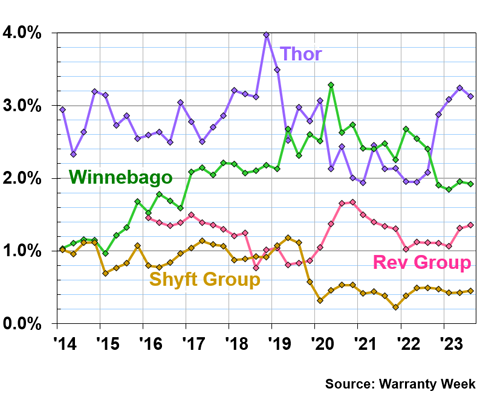
In the third quarter of 2023, Thor accrued 3.1% of its total product revenue for future warranty expenses. This rate is up quite a bit compared to the last three years.
Winnebago's accrual rate was 1.9% in the third quarter, down a bit compared to the last four years, even pre-pandemic. Rev Group's accrual rate was 1.4% in the third quarter, and Shyft Group's accrual rate was 0.5%.
Boat Warranties
The next of our three recreational industries is boats. As always, we're limited to those companies that do report their warranty expenses in their annual and quarterly reports, but we managed to represent a good portion of the U.S.-based market with these three companies.
First, we'll take a look at their claims totals in Figure 5.
Figure 5
Boat Warranties:
Claims Paid by Top U.S.-based Manufacturers
(in US$ millions, 2014-2023)
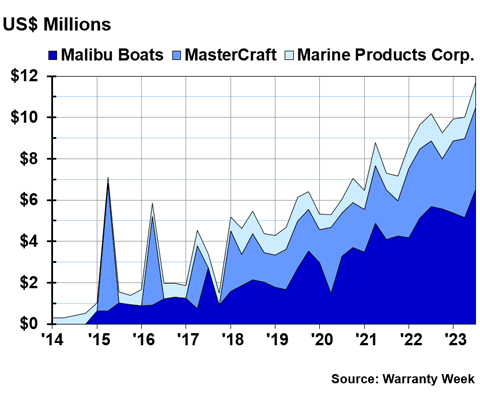
Notice the scale of the y-axis of Figure 5. We're talking about a total of not even $12 million in warranty claims, compared to the total of about $120 million we saw in Figure 1. Keep in mind that on a smaller scale, relatively small variations in totals can look much more dramatic.
The largest of the three companies in terms of total warranty expenses is Malibu Boats, which paid $6.5 million in claims in the third quarter of 2023. This was up 15% compared to the same quarter in 2022, and was actually the highest quarterly claims total the company has paid since it started reporting in 2015.
Next is MasterCraft Boat Holdings, which paid $3.96 million in claims in the third quarter of 2023, up 25% compared to the third quarter of last year. This is once again the highest claims total the company has paid since it started reporting in 2015. Note that MasterCraft only reported its warranty expenses on an annual basis in 2015, 2016, and 2017, and its fiscal year ends on June 30, thus those results are presented in the second quarter when we normalize our data to the calendar year. Those spikes in those three years in Figure 5 can be a little misleading without the context that those are the whole totals for each year, all reported at once rather than on a quarterly basis.
Finally, we have Marine Products Corp., which paid $1.2 million in claims in the third quarter of 2023. This was down a bit compared to the same quarter the year prior.
Figure 6 shows the three companies' total warranty accruals over the past decade.
Figure 6
Boat Warranties:
Accruals Made by Top U.S.-based Manufacturers
(in US$ millions, 2014-2023)
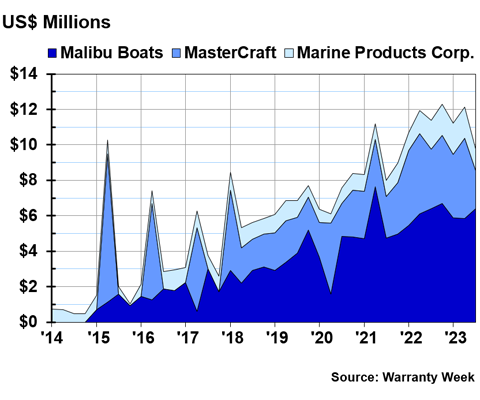
First, we will again point out that the spikes in MasterCraft's totals in 2015, 2016, and 2017 are a result of them reporting on an annual basis, for their fiscal year that ends in June, rather than three subsequent mid-year disasters causing increases in warranty costs. MasterCraft began reporting warranty expenses quarterly in 2018.
We do not have a comparable technical explanation for the spike in Malibu Boats' accruals during the second quarter of 2021, which seems to have been driven by an increase in sales. Interestingly, Malibu Boats increased the length of many of its product warranties from three years to five years in 2016, so 2020 and 2021 were the first time that the company fulfilled warranty claims during the fourth and fifth years of the product's lifecycle. It's possible they factored in extra warranty accruals because they weren't certain what the expenses would be, lacking historical claims data from years four and five.
More recently, Malibu Boats accrued $6.4 million during the third quarter of 2023, on par with the year prior. MasterCraft accrued $2.1 million, down -36% compared to the third quarter of 2022. And Marine Products accrued $1.2 million, down -25% compared to the same quarter in 2022.
Next, we'll take a look at the warranty expense rates for these three boat manufacturers. First, we'll analyze the warranty claims rates.
Figure 7
Boat Warranties:
Claims Rates for Top U.S.-based Manufacturers
(as % of product revenue, 2014-2023)
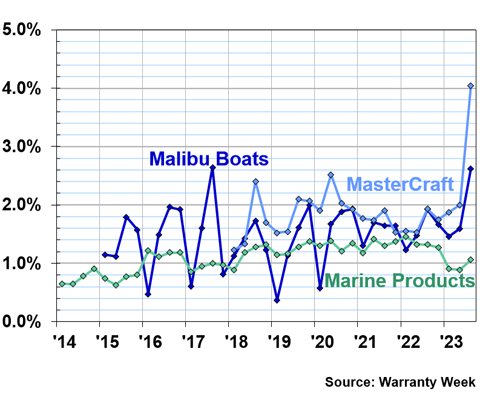
We can see that Malibu Boats, MasterCraft, and Marine Products all were averaging around 2% claims rates, until the most recent quarter threw a wrench in things. Malibu Boats and MasterCraft both saw big increases in their claims rates in the third quarter of this year. Malibu Boats spent 2.6% of product revenue on warranty claims in the third quarter, up about a third compared to the same time of year in 2022. And MasterCraft's claims rate was 4.0%, double what it was the year prior. In contrast, Marine Products' claims rate was 1.1% in the third quarter, a little lower than where it was the same time in 2022.
Our final warranty metric for the boat industry is the accrual rates of the three companies, shown in Figure 8.
Figure 8
Boat Warranties:
Accrual Rates for Top U.S.-based Manufacturers
(as % of product revenue, 2014-2023)
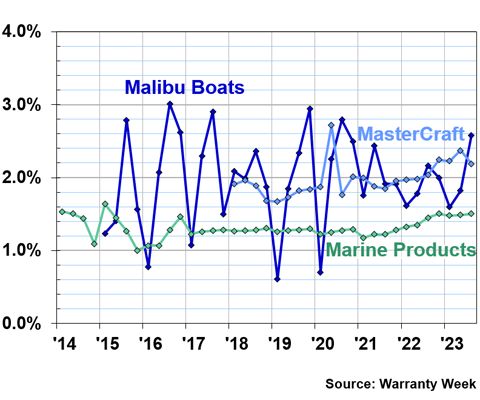
It's very interesting to see that MasterCraft's claims rate doubled in Figure 7, but the accrual rate in Figure 8 hasn't changed much at all. This seems to be explainable by a combination of lower product sales and a higher-than-usual claims total in the third quarter. In the third quarter of 2023, MasterCraft's accrual rate was 2.2%
Malibu Boats' accrual rate was 2.6%, up a bit compared to the year prior. And Marine Products' accrual rate was 1.5%, consistent as ever.
Next, we'll take a look at the same four warranty metrics for our two U.S.-based motorcycle manufacturers, Harley-Davidson and Polaris. Remember that Polaris also makes ATVs and snowmobiles.
Motorcycle Warranties
Figure 9 shows the warranty claims totals for Harley-Davidson and Polaris over the past decade.
Figure 9
Motorcycle Warranties:
Claims Paid by Top U.S.-based Manufacturers
(in US$ millions, 2014-2023)
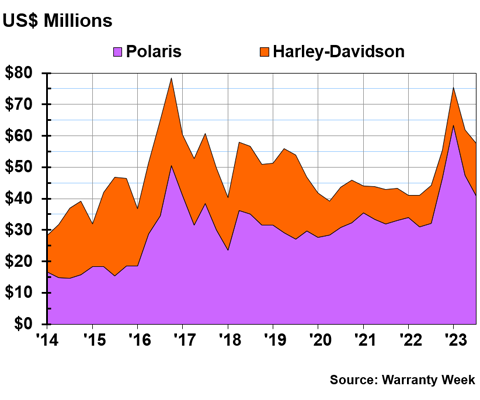
Polaris actually saw a huge spike in its total claims payments at the beginning of this year, rising to $63.4 million in the first quarter of 2023. Before the end of 2022, the company averaged around $30 million in claims payments per quarter. In the third quarter of 2023, Polaris paid $40.9 million in claims, up 27% compared to the same quarter the year prior.
Harley-Davidson paid $16.8 million in claims in the third quarter of 2023, up 39% compared to the same quarter the year prior. However, unlike Polaris, this certainly is not the highest claims total Harley-Davidson has reported. The company was paying more like $25 million per quarter in claims earlier in the decade, and these numbers only fell below $20 million per quarter in 2020. Claims payments have remained relatively low for the company since then.
Next, we'll take a look at accrual totals for the two manufacturers.
Figure 10
Motorcycle Warranties:
Accruals Made by Top U.S.-based Manufacturers
(in US$ millions, 2014-2023)
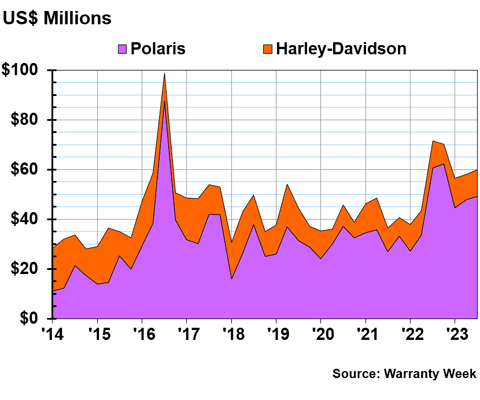
In the third quarter of 2023, Polaris accrued $49.3 million, down -19% compared to the same quarter in 2022. Harley-Davidson accrued $10.6 million in the third quarter of 2023, down -5% compared to the same quarter the year prior.
Figure 10 shows the two motorcycle manufacturers' warranty claims rates over the past decade.
Figure 11
Motorcycle Warranties:
Claims Rates for Top U.S.-based Manufacturers
(as % of product revenue, 2014-2023)
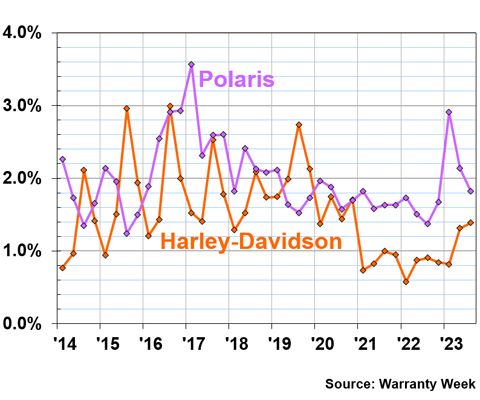
Both motorcycle companies have seen a great deal of fluctuation in their warranty expense rates, even from one quarter to the next. Polaris' claims rate rose by a full percentage point over just one quarter, from the fourth quarter of 2022 to the first quarter of 2023. And then the rate has fallen a full percentage point again over the past two quarters, back to where it started. In the third quarter of 2023, Polaris' claims rate was 1.8%.
Harley-Davidson's claims rate fell quite a bit in early 2021, but has risen again during 2023. In the third quarter of this year, the company spent 1.4% of its product revenue on warranty claims costs.
Since both companies' expense rates fluctuate so much, we found each company's average claims rate over the ten year period. Polaris' average claims rate was 2.0%, and Harley-Davidson's was 1.5%. So both are actually not far off from their ten-year averages, despite the oscillation on the chart.
Finally, we'll take a look at both manufacturers' warranty accrual rates over the decade.
Figure 12
Motorcycle Warranties:
Accrual Rates for Top U.S.-based Manufacturers
(as % of product revenue, 2014-2023)
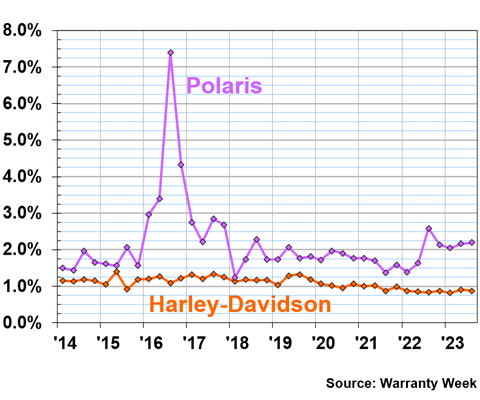
Yes, we do see more consistency in accruals, compared to the claims rates in Figure 11. But we are also on a larger scale in Figure 12, so bumps look smoother because it's zoomed out. Polaris' quarterly accrual rates are just about as volatile as its claims rates, but Harley-Davidson is significantly smoother and more consistent with its accruals.
Over ten years, Harley-Davidson's accrual rates range from 0.8% to 1.4%. It's an impressive level of steadfast consistency and reflects a very solid formula for calculating quarterly accruals. In the third quarter of 2023, Harley-Davidson's accrual rate was 0.9%.
Figure 12 highlights the same trouble in 2016 for Polaris that we can see reflected in Figures 9, 10, and 11. The company had a huge spike in total accruals and its accrual rate, followed closely by spikes in claims. Since then, Polaris' accrual rate has smoothed out, though not as much as Harley-Davidson's. However, over ten years, Polaris had an average accrual rate of 2.2%, and in the third quarter of 2023, the accrual rate was also 2.2%. So the company is currently right on average, and thus perfectly on target.
Call for Submissions
Have you come across a reference to warranty or extended warranty in a movie, television show, video game, book, etc. recently? Please reply to this email or use the contact form on our website, and tell us about it! You could be featured in an upcoming edition of Warranty Week!