

Worldwide Auto Warranty Expenses:
In the past few years in the worldwide auto industry, we've seen some new EV manufacturers come onto the scene in the U.S. and China, and a major merger between competitors in Europe. In 2022, the industry paid a total of $43.1 B in claims, with a 2.1% claims rate, accrued $54.7 B, with a 2.7% accrual rate, held a total of $120.8 B in warranty reserves, and accrued an average of $670 per vehicle sold.
It is once again the time of year that we present our report on the warranty expenses of all of the world's major automotive OEMs. Of all industries that sell items that come with product warranties, the passenger car and light truck manufacturers have by far the most comprehensive reporting practices, and provide some of the highest industry-wide totals, meaning this is our most major global report of the year.
With some new additions over the past few years, Warranty Week is now tracking 32 auto manufacturers around the world that report all or some of their warranty metrics to investors in their annual reports. Most report the amount they pay in claims, the amount of accruals they make, and the amount they hold in warranty reserves. Some report only the amount they hold in warranty reserves at the end of each fiscal year. And a few report that metric along with the amount of accruals they make.
We fashion estimates for the missing metrics of those partial reporters, and full estimates based on industry-wide averages for an additional six manufacturers. That makes a total of 38 manufacturers in this report. For each of the warranty metrics we track, we have about 95% hard data, and 5% estimates.
Methodology
For each passenger vehicle manufacturer, we gathered data for three key warranty metrics from each of their annual reports: the amount of claims paid, the amount of accruals made, the amount of warranty reserves held. In addition, we gathered sales data on the unit number of vehicles sold, and the amount of segmented vehicle sales revenue.
With the claims, accruals, and sales revenue data, we calculated our two expense rates: claims as a percentage of sales (the claims rate), and accruals as a percentage of sales (the accrual rate). And with the accruals and unit sales data, we calculated one additional ratio: the dollar amount of accruals made per vehicle sold.
The totals help reveal the top players in the industry, in terms of warranty spending. The ratios help us compare the smaller worldwide auto manufacturers to their largest competitors, and reveal which companies are paying higher- or lower-than-average claims or accruals, normalized by sales data.
We gathered data from 32 passenger car and light truck manufacturers from six markets.
From the United States, we followed Ford Motor Co., General Motors Co., and Tesla Inc.
From Europe, we collected data from Volkswagen AG, Stellantis N.V., Mercedes-Benz Group AG, BMW AG, Renault S.A., and Volvo Car AB, as well as two new reporters making their debuts, Ferrari S.p.A., and Polestar Automotive Holding UK PLC.
Note that both Volvo Cars and Polestar, its former subsidiary, are based in Sweden, but owned by the Chinese Geely Holding Group. Since Volvo Cars and Polestar both report their warranty expenses separately, we are including them in this report. Geely Auto, the largest subsidiary of the Geely Group parent, actually does not report its warranty expenses at all.
From South Korea, we followed Hyundai Motor Co. and Kia Motors Corp.
Japan brought in Toyota Motor Corp., Honda Motor Company Ltd., Subaru Corp., and Mitsubishi Motors Corp. as full reporters of all three warranty metrics. Subaru, usually late to report, published its data just in time for inclusion in this newsletter, and we commend them for it. In addition, we have Nissan Motor Company Ltd. and Isuzu Motors Ltd. as partial reporters; they provide two of the three warranty metrics, but do not report the total amount they pay in warranty claims per year. We also have Mazda Motor Corp. and Hino Motors Ltd., which report the year-end balance of their warranty reserve funds, but do not detail their total annual claims and accruals.
Joining them from India, we followed Tata Motors Ltd. and Mahindra & Mahindra Ltd.. All of the companies in India and Japan use fiscal years that end on March 31, three months later than their peers, so their annual reports are typically published in the summer months. We do not time-shift these data; e.g., the data for the fiscal year from April 1, 2022 to March 31, 2023 were counted in the 2022 worldwide totals.
From China, we now have nine auto manufacturers that report at least some warranty expense data. Seven of the nine report all three warranty metrics: BYD Company Ltd., BAIC Motor Corp. Ltd., Chang'an Automobile Co. Ltd., Nio Inc., Li Auto Inc., Dongfeng Motor Corp., and XPeng Inc. We also have reserves and accrual totals for Guangzhou Automobile (GAC) Group Co. Ltd., but they do not report total warranty claims payments. In addition, SAIC Motor Corp. Ltd. provides data on the year-end balance of its warranty reserve fund, but does not report total claims paid or accruals made.
All data was gathered in its native currency, and then translated into U.S. dollars. For the sake of simplicity and transparency, we use the exchange rates from the Yearly Average Currency Exchange Rates table published by the U.S. Internal Revenue Service.
Just six of the 38 companies we tracked for this report did not report any warranty expense data in 2022. From Japan, there was Suzuki Motor Corp. The other five manufacturers were Chinese: China First Automobile Works (FAW) Group Corp. Ltd., Geely Auto, Chery Automobile Co. Ltd., JAC Motors, and Great Wall Motor (GWM) Co. Ltd.
For the six manufacturers that did not publish any warranty expense data, we fashioned estimates using their annual vehicle sales revenue, which all but FAW, JAC, and Chery do report, and national industry average claims and accrual rates. For companies that have reported in the past, but have not yet reported their 2022 numbers, such as Suzuki, we also used past data to calculate the estimates. And for those companies that report some data points, but not all, namely SAIC, Nissan, Mazda, GAC, Isuzu, and Hino, we used the provided revenue, warranty reserves, and, in some cases, warranty accrual data to fashion our estimates..
In 2022, these estimates comprise 5% of the claims totals, 6% of the accrual and reserves totals, 13% of the worldwide sales revenue, and 17% of the unit sales. The estimates are a smaller proportion of the warranty metrics as opposed to the sales metrics mainly because the Chinese auto manufacturers tend to have lower claims and accrual rates than the worldwide industry averages.
SAIC, Nissan, and GAC are the only manufacturers named in any of the following charts for which we fashioned estimates for some of their warranty expenses, and those estimates are based on some extant, reported hard data on that year's warranty expenses. Even still, the top 11 companies based on warranty metric totals named in Figures 1, 3, and 7 are all hard data, with all of the estimates falling into the Other category.
Without any further ado, let's take a look at the 2022 worldwide automotive warranty expense data.
Warranty Claims Totals
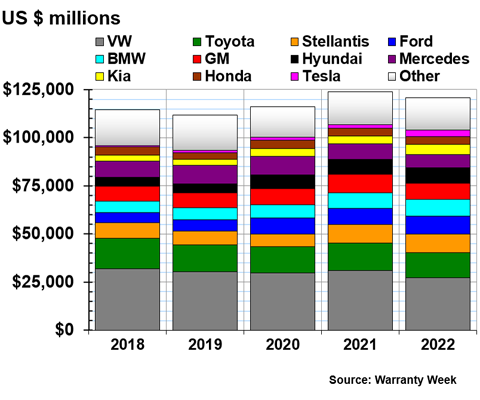
In 2022, the estimated worldwide total for warranty claims paid fell by -6%, from $45.831 billion in 2021, to $43.104 billion in 2022. As shown in Figure 1, this was the lowest worldwide total of the last five years, intriguingly even lower than the pandemic years 2020 and 2021.
Just the 11 largest claims payers fit into the format of each chart, but rest assured there are 26 sets of hard data in there, plus 12 more estimates included in the totals.
Figure 1
Worldwide Auto Manufacturers
Claims Paid per Year
(in millions of U.S. dollars, 2018-2022)
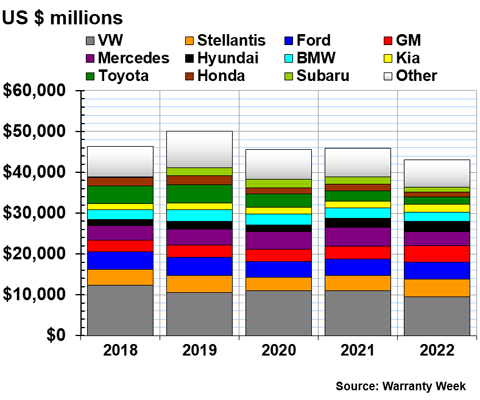
Volkswagen continues to top the list as the largest claims payer by far, though its total claims fell a bit below the $10 billion threshold for the first time since 2015, to $9.47 billion in 2022.
Mercedes-Benz fell from the second-highest claims payer in 2021 to fifth in 2022, mainly due to the spin-off of Daimler Truck, formerly its commercial vehicle division, as a separate company at the end of 2021. The company's total claims payments fell by one-quarter from 2021 to 2022. Meanwhile, a relatively new player in the industry, fellow European Stellantis, rose from fourth in 2021 to second in 2022. Stellantis was formed from the merger of Fiat Chrysler Automobiles (FCA) and Peugeot (PSA) Group at the beginning of 2021, and the data from 2020 and earlier are those of the exceedingly larger FCA.
Stellantis, Ford, and GM all had total claims payments in the range between $4 and $4.5 billion. Mercedes-Benz was the only manufacturer with total claims in the $3 billion range. Hyundai and BMW both paid claims of a total between $2 and $2.5 billion. and Kia, Toyota, Honda, and Subaru all made claims payments that totaled between $1 and $2 billion.
The largest increase in total claims among the top 11 came from General Motors, which saw its payments rise by 26% from 2021 to 2022. Subaru had the largest decrease in its claims payments, with that total falling by -36% from 2021 to 2022.
Among all 26 companies for which we have hard data on total claims payments, BYD had the largest increase. BYD's claims payments more than doubled from 2021 to 2022, an increase of 122% to $279 million. Fellow Chinese electric vehicle (EV) manufacturers Nio Inc. and Li Auto had similar meteoric rises in total claims payments, both also doubling. Tesla, the United States' manufacturer of only EVs, saw its total claims payments rise by about 50%.
Warranty Claims Rates
In order to normalize for each manufacturer's vehicle sales revenue, we are detailing the claims rates for 24 of these OEMs in Figure 2. This is useful because huge rises in claims totals don't always mean major malfunctions, nor more frequent and costly claims. Often, as we see with the EV OEMs, these increases simply reflect increases in sales, and parallel increases in warranty expenses as a natural result of more units being on the road.
In Figure 2, only Nissan's claims rate was calculated using estimates, and the rest are entirely based on hard data.
Figure 2
Worldwide Auto Manufacturers
Average Warranty Claims Rates
(as a percentage of sales, 2021 & 2022)
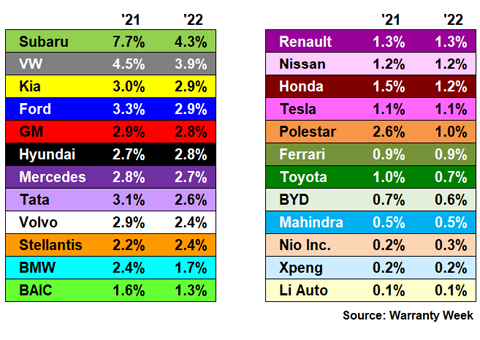
At the top of the list is Subaru, with a claims rate of 4.3% in 2022. This is actually down from a very high 7.7% in 2021. When we reported last year's worldwide auto expenses, Subaru hadn't published its annual report yet, so we didn't know what a high proportion of its revenue the company was paying in claims. The company only started reporting its warranty expenses in 2019, and is often one of the last among the auto OEMs to put out its annual reports.
VW is in second with a claims rate of 3.9%. Volkswagen has topped this list for years, going back almost a decade to the start of the "Dieselgate" scandal. This is the first time since then that VW didn't have the highest claims rate in the industry.
Kia, Ford, GM, Hyundai, Mercedes-Benz, Tata, Volvo Cars, and Stellantis are all in the two-percent range. BAIC, Honda, Renault, Tesla, and Toyota are all in the one-percent range. The industry average is typically around 2.5%, but for 2022, the worldwide average claims rate actually fell to 2.1%.
This global average was undoubtedly brought down by the several Chinese manufacturers on this list with claims rates below 1%. We have Chang'an, GAC, BYD, Dongfeng, Nio, XPeng, and Li Auto, joined by India's Mahindra, in this low range.
Part of this is the larger trend we've noticed, where EV-only manufacturers tend to have much lower claims rates. This explains Li, XPeng, Nio, and BYD at the very bottom of the list, as well as Tesla not much higher. However, this doesn't tell us why fellow Chinese OEMs Chang'an, GAC, Dongfeng, and BAIC also have claims rates much lower than the industry average.
Warranty Accrual Totals
Auto manufacturers worldwide accrued an estimated $54.655 billion in 2022, up 3% from $53.221 billion in 2021. As we can see in Figure 3, this is the highest global accrual total over the last five years.
Nine of the 38 entries in this chart are estimates, but they all fall in the "Other" category. The top 11 companies in Figure 3 are all hard data.
Figure 3
Worldwide Auto Manufacturers
Accruals Made per Year
(in millions of U.S. dollars, 2018-2022)
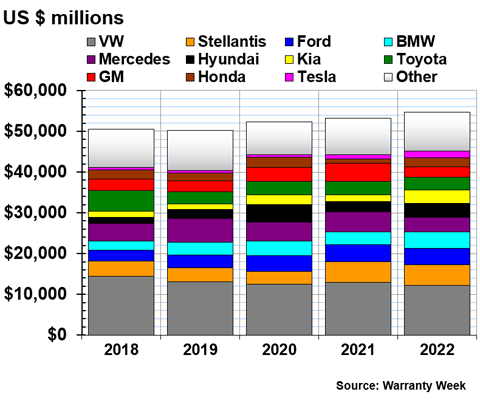
The top two accrual-makers in the industry, Volkswagen and Stellantis, stayed in the same positions in this chart from 2021 to 2022. VW accrued $12.12 billion, down -7%, while Stellantis' accruals rose by just 2% to $5.13 billion. Ford had the third-highest accrual total, $4.03 billion. Ford rose from fifth to third, but its total accruals actually fell by a bit, -2%.
GM had the largest decrease in accruals, down -42%, from $4.49 billion in 2021 to $2.59 billion in 2022. This drop brought GM from the fourth-highest accruals in the industry in 2021, to ninth in 2022. Mercedes-Benz' accruals fell by a quarter due to the Daimler Truck spin-off, which caused a similarly-sized drop in both claims and accruals.
Outside of the top 11, Subaru's total warranty accruals fell by -20% to $1.19 billion, and Renault's fell by -27% to $493 million. Dongfeng's accruals also fell by a quarter, to $109 million.
Kia's accruals more than doubled, from $1.59 billion in 2021 to $3.30 billion in 2022. This is the result of a "voluntary recall," which is part of a larger engine recall that's been going on for almost a decade for Kia and its compatriot and partial owner Hyundai.
Honda also saw its accruals double, from $1.08 billion in 2021 to $2.21 billion in 2022. This is not the result of a recall, but rather a return to normal accruals after an abnormally low total in 2021. Tesla's accruals rose by 60% to $1.69 billion, bringing the company into the top 11 globally for the first time. The company's total warranty expenses have been growing rapidly, as have its global vehicle sales.
Beyond the top 11, fellow EV manufacturer BYD's accruals more than quintupled, from just $190 million in 2021 to $1.05 billion in 2022. Similarly, Li's accruals increased by 22% and Polestar's by 47%. Mahindra more than doubled its warranty accruals, from $33 million in 2021 to $72 million in 2022.
Warranty Accrual Rates
Typically, warranty accruals rise and fall proportionally to sales. For instance, in 2022, Tesla's accruals rose by 60%, and its vehicle sales revenue rose by 40%; for one of its biggest competitors, BYD, accruals rose by 450%, while sales rose by 150%.
For a company like GM, where sales rose by 27%, while total accruals fell by -42%, this means a big drop in the accrual rate, and significant savings on warranty expenses overall.
GM saw the largest drop in the accrual rate, which is great news for the company, though its claims rate and total show it was still paying to replace the faulty Chevy Bolt electric batteries during 2022. Those who did not fare as well include Kia, which shot up to the top of the list, and Honda and BYD, which saw their accrual rates double.
Figure 4 shows the accrual rates for the top 26 manufacturers in the global auto industry, all of which were calculated using hard data, except for SAIC.
Figure 4
Worldwide Auto Manufacturers
Average Warranty Accrual Rates
(as a percentage of sales, 2021 & 2022)
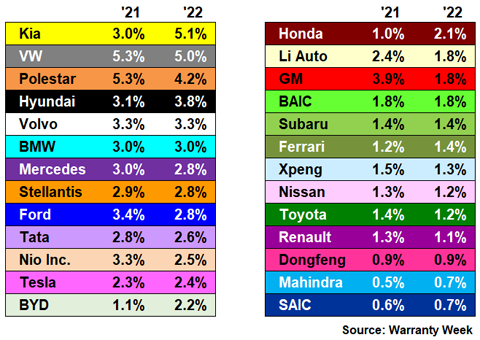
VW, which has had the highest accrual rate in the industry for years, in addition to the highest total, has seen this ratio fall since 2020. Meanwhile, Kia's accrual rate rose above 5% in 2022, and surpassed VW for the top spot in Figure 4.
Polestar, in just its third year of reporting its warranty expenses, was in third place, with an accrual rate of 4.2%. This is actually a drop from 2021's rate of 5.3%, and an even further drop from 2020's whopping 10.8%.
Hyundai's accrual rate rose by about a quarter, to 3.8%. Joining Hyundai in the three-percent range are Volvo Cars and BMW. In the two-percent range, we have Mercedes-Benz, Stellantis, Ford, Tata, Nio, Tesla, BYD, and Honda. Based on hard data alone, the industry's average accrual rate was 2.7%.
With accrual rates below average, in the one-percent range, are Li Auto, GM, BAIC, Subaru, Ferrari, XPeng, Nissan, Toyota, and Renault. And at the very low end, below 1%, are Dongfeng, Mahindra, and SAIC.
Accruals per Vehicle Sold
Another way to normalize the accrual totals in Figure 3 is to divide them not by vehicle sales totals, as we did in Figure 4, but to divide them by the total number of vehicle units sold. This gives us an exact dollar amount that each manufacturer puts aside for future warranty costs every time it sells a new vehicle.
This metric makes the warranties of luxury vehicles and electric vehicles look expensive, as we will see in Figure 5a. And it makes the warranty costs of Chinese vehicles look particularly inexpensive, suggesting either very high quality, or very inexpensive warranty work, as shown in Figure 5c.
In a year like 2022, this metric in particular also likely reflects the volatility, inflation, and devaluation of many global currencies, so we won't extrapolate too much from these results.
Figure 5a shows the high range of accruals per vehicle sold, from $1,200 to $5,000. Figure 5b shows the mid-range, from $500 to $1,200. And Figure 5c depicts the low range, from $20 to $500.
Figure 5a
Worldwide Auto Manufacturers
Accruals Made per Vehicle Sold
(in U.S. dollars, 2021 & 2022)
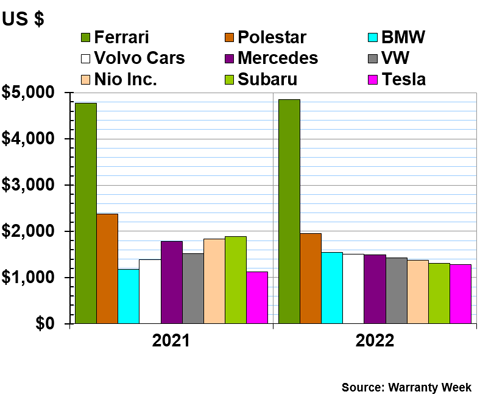
Unsurprisingly, luxury brand Ferrari has by far the highest accruals per vehicle sold, at $4,858. Next is the luxury EV brand Polestar, at $1,950, then fellow luxury European brands BMW, Volvo Cars, Mercedes-Benz, and Volkswagen. Rounding out the list are two more luxury EV brands, the Chinese Nio and the American Tesla, as well as the Japanese luxury car maker Subaru.
BMW had the largest increase in its accruals per vehicle sold among these nine, while Subaru had the largest decrease. Polestar, Mercedes-Benz, VW, and Nio also saw this metric fall, while Ferrari, Volvo, and Tesla saw small rises.
Figure 5b
Worldwide Auto Manufacturers
Accruals Made per Vehicle Sold
(in U.S. dollars, 2021 & 2022)
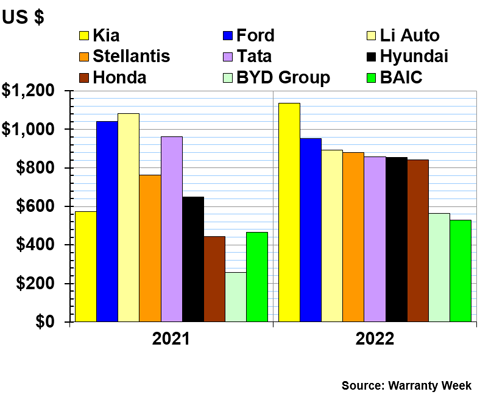
At the top of the mid-range is Kia. The company accrued $573 per vehicle in 2021, and saw this metric double in 2022, to $1,137 per vehicle.
Ford came in just under $1,000, at $952 per vehicle. This was a slight decrease from the year prior. Ford, Li Auto, and Tata were the only three of the nine manufacturers in the mid-range to see their accruals per vehicle drop from 2021 to 2022.
BYD had an even larger increase in this metric than Kia did. BYD's accruals per vehicle more than doubled, from $257 in 2021 to $563 in 2022. Honda also saw a large jump, up 89% to $843 in 2022. Stellantis, Hyundai, and BAIC also saw increases, though not nearly as large.
Figure 5c
Worldwide Auto Manufacturers
Accruals Made per Vehicle Sold
(in U.S. dollars, 2021 & 2022)
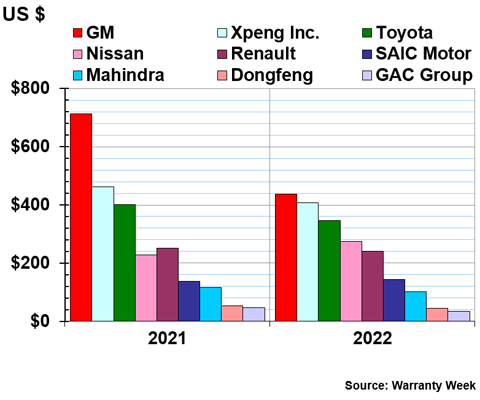
GM's accruals per vehicle fell by -40% to $437, dropping the company down to the lowest range chart. XPeng, Toyota, Renault, Mahindra, Dongfeng, and GAC all also saw drops in this metric from 2021 to 2022, though they were already in the low range to start with.
Nissan saw this metric rise by 20%, while SAIC rose by just 4%.
At the very low end, we have Dongfeng accruing just $44 per vehicle sold, and GAC accruing $34.
Worldwide Average Warranty Expense Rates
Typically, we use 2.5% as the average benchmark for the warranty expense rates in this industry. But we found that from 2013 to 2022, the worldwide average claims rate was 2.41%, the average accrual rate was 2.84%, and the combined average of both was 2.62%.
Figure 6 depicts the industry average claims and accrual rates, for all of the manufacturers for which we have hard data. Our estimates are not factored into any of the averages in this chart.
Figure 6
Worldwide Auto Manufacturers
Average Claims & Accrual Rates
(as a percentage of sales, 2013-2022)
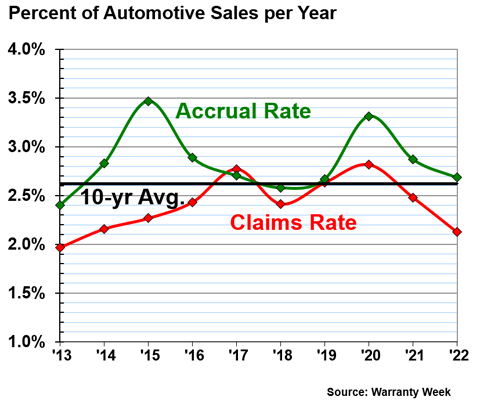
As we can see in Figure 6, driving up that industry-wide, ten-year average accrual rate are the 2015 and 2020 average accrual rates. In 2015, the worldwide auto OEMs experienced the Takata airbag recall and the VW Diesel emissions scandal, which threw the whole industry for a loop it's still recovering from today. Tesla, Hyundai, and Kia also experienced their own recalls in 2015. And, of course, the onset of the pandemic in 2020 caused vehicle sales to plummet, driving up expense rates.
The industry average claims and accrual rates have both been falling in recent years. In 2022, the average claims rate fell to its lowest point since 2013, showing recovery from those fateful recalls and warranty costs of 2015. However, the average accrual rate still remains higher than its 2013 level, showing caution from the manufacturers despite relatively fair weather in recent years.
Warranty Reserve Balances
Our final metric is the balance in each manufacturer's warranty reserve fund at the end of each of the last five years, depicted in Figure 7.
For this metric, we crafted estimates for only six of the 38 manufacturers, and all of those fall in the "Other" category.
Figure 7
Worldwide Auto Manufacturers
Reserves Held at Year's End
(in millions of U.S. dollars, 2018-2022)
The worldwide total warranty reserve fund balance was about $123 billion, down a bit from 2021's $126 billion.
Volkswagen continues to have the world's largest warranty reserve fund, even down -12% to a $27.39 billion balance at the end of 2022.
Toyota had the second-largest warranty reserve fund in the global automotive industry, with an ending balance of $12.83 billion, though this was also down -9%. Stellantis was in third with $9.72 billion, after growing its reserves significantly in 2021, but keeping the balance just about the same in 2022.
GM, which was in third in 2021, was ranked sixth at the end of 2022. The company had grown its reserves due to the Chevy Bolt recall, and in 2022, it accrued less, but paid more in claims.
Ford was in fourth with $9.19 billion, and BMW was in fifth with $8.68 billion. Both grew their reserves by about 10% from 2021 to 2022.
Among the top 11, Tesla saw the largest growth in its warranty reserve balance, an increase of about two-thirds from $2.10 billion to $3.51 billion. Kia's reserves increased by a little less than one-third.
Outside of the top 11, BYD tripled its warranty reserve fund balance, from $365 million at the end of 2021 to $1.12 billion at the end of 2022. Li Auto similarly increased its reserves by 80% to $237 million, and Polestar increased by 90% to $124 million. Fellow EV manufacturers XPeng and Nio increased their reserves by 66% and 44%, respectively.
The largest drop in warranty reserves was from Renault, which decreased by -22% to $919 million. Although we saw several huge percentage change increases in manufacturers' reserve balances, the almost $4 billion decrease in Volkswagen's warranty reserve fund balance was enough to drive down industry-wide total reserves for 2022.
Welcome to all of our new subscribers!
In case you missed any newsletters in our summer series on worldwide auto warranties, here are links to the online editions:
- U.S. Auto OEM Update
- European Automaker Warranty Expenses
- Top Japanese Automaker Warranty Expenses
- Top Korean & Indian Automaker Warranty Expenses
- Chinese EV Warranty Expense Rates
- U.S. EV-Only Warranty Expense Rates


