

U.S. Power Generation Equipment Warranty Expenses:
Warranty costs doubled, tripled, and even quadrupled for a few solar manufacturers in 2025. In its second year of reporting, GE Vernova saw its warranty claims costs decrease, but increased its accruals and reserves.
We're returning to our series of 23-year charts of the warranty expenses of U.S.-based manufacturers with Power Generation Equipment, the final industry we're highlighting in the Building Trades sector.
This industry is comprised of manufacturers of wind turbine components, solar cells, panels, and inverters, portable generators, utility poles, electric vehicle chargers, batteries, and other energy storage products.
Renewable energy equipment limited warranties tend to be longer than those attached to fossil fuel equipment, with the intention to instill confidence in the reliability and longevity of relatively new renewable energy technologies. At Warranty Week, we've seen limited warranty lengths of 10, 15, 20, 15, and even 50 years for renewable energy products such as solar cells and microinverters.
General Electric
The largest U.S.-based manufacturer in this industry is GE Vernova. In April 2024, General Electric finalized its split into three separate corporations, GE Aerospace, GE Vernova, and GE HealthCare.
GE Aerospace is the successor of the former parent GE, and GE Vernova is a new entity, comprised of the former divisions GE Power, GE Renewable Energy, GE Digital, and GE Energy Financial Services. Leading up to the spin-offs, in 2022, GE sold its nuclear turbine business to EDF, the French state-owned electric utility company.
Post-spin-off, GE Vernova was organized into three divisions: Power, Wind, and Electrification. The Power segment handles gas, nuclear, and hydro technologies, while the Wind segment handles on- and off-shore projects, and turbines and blades. The Electrification segment handles grid infrastructure, power conversion, and solar and storage.
GE Vernova, Aerospace, HealthCare each filed separate 2024 annual reports. In our March 2025 newsletter "GE's Warranty Expenses by Industry," we found that about 55-65% of the former parent GE's warranty expenses were from the power generation industry, while about 15-25% were from aerospace, and about 20% were from medical equipment.
In its 2024 annual report, GE Vernova provided two years of previous data, beginning in 2022. In the following charts, we depict the parent GE's warranty expenses, from 2003 to 2021, in blue, and the warranty expenses of the spin-off GE Vernova, from 2022 to 2025, in green. General Electric published its warranty expenses on an annual basis, while GE Vernova does so on a quarterly basis.
As we will see in Figures 1, 2, and 4, GE Vernova's total warranty expenses have increased since the spin-off, even exceeding those of the former parent GE.
Methodology
To create this newsletter, we first identified 66 U.S.-based manufacturers that reported warranty expenses between 2003 and 2025. Of them, 30 reported warranty expenses in calendar 2025.
Many of those 30 manufacturers are relatively small renewable energy companies, including solar, wind, nuclear, and EV charging. A little over half of these manufacturers paid less than $10 million in warranty claims in 2025.
By warranty costs, the largest U.S.-based power generation equipment manufacturers were: GE Vernova Inc., SolarEdge Technologies Inc., Generac Holdings Inc., TPI Composites Inc., First Solar Inc., Valmont Industries Inc., Enphase Energy Inc., Bloom Energy Corp., Microvast Holdings Inc., and Fluence Energy Inc.
We perused the annual reports and quarterly financial statements of each manufacturers, and gathered three warranty metrics: the amount of claims paid, the amount of accruals made, and the amount of reserves held.
We also gathered data on each manufacturer's product sales revenue, and used these to calculate two warranty expense rates: claims as a percentage of sales (the claims rate), and accruals as a percentage of sales (the accrual rate).
Warranty Claims Totals
Figure 1 shows the total warranty claims paid by the U.S.-based power generation equipment manufacturers, from 2003 to 2025.
Figure 1
Power Generation Equipment Warranties
Claims Paid by U.S.-based Manufacturers
(in US$ millions, 2003-2025)
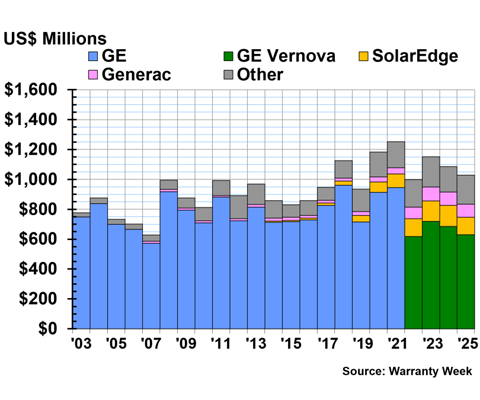
The U.S.-based power generation equipment industry paid $1.02 billion in warranty claims in 2025, a -5% decrease from 2024.
GE Vernova paid $629 million in warranty claims in 2025, a -8% decrease from 2024. SolarEdge Technologies paid $118 million in warranty claims in 2025, a -16% decrease. Generac paid $86 million, a -3% decrease.
First Solar paid $23 million in claims, a 78% increase from 2024. First Solar's 2025 10-K annual report notes,
"We have identified manufacturing issues affecting certain Series 7 modules manufactured in 2023 and 2024 that may cause the modules to experience premature power loss once installed in the field. [...] Based on currently available information, various settlement agreements with customers, and certain assumptions and estimates, we believe a reasonable estimate of the aggregate remaining losses related to these manufacturing issues will range from approximately $35 million to $75 million. Within that range, we recorded a specific warranty liability of $50 million as of December 31, 2025, which represents our best estimate of expected future losses related to the identified manufacturing issues."
Further in the annual report, First Solar notes a key aspect of warranty accounting in the solar field:
"Although our module performance warranties extend for up to 30 years, our oldest solar modules manufactured during the qualification of our pilot production line have only been in use since 2001. Accordingly, our warranties are based on a variety of quality and life tests that enable predictions of durability and future performance. These predictions, however, could prove to be materially different from the actual performance during the warranty period, causing us to incur substantial expense to repair or replace defective solar modules or provide financial remuneration in the future."
TPI Composites paid $31 million in warranty claims in 2025, a -10% decrease from 2024. Valmont Industries paid $22 million in claims, a 5% increase. Enphase Energy paid $20 million, a -6% decrease.
Array Technologies paid $10 million in claims in 2025, quadruple 2024's $2 million in claims. SunPower paid $6 million in claims in 2025, sextuple 2024's $1 million in claims.
Warranty Accrual Totals
Figure 2 shows the total warranty accruals made by the U.S.-based power generation equipment manufacturers, from 2003 to 2025.
Figure 2
Power Generation Equipment Warranties
Accruals Made by U.S.-based Manufacturers
(in US$ millions, 2003-2025)
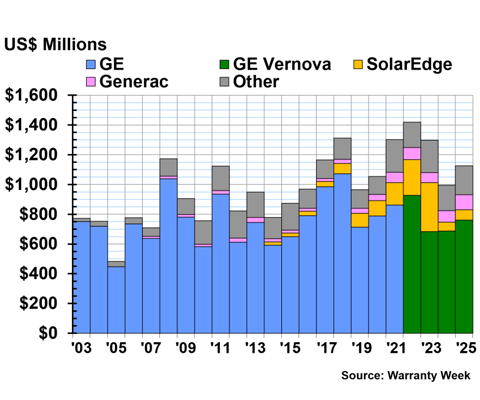
The U.S.-based power generation equipment manufacturers set aside $1.13 billion in warranty accruals in 2025, a 13% increase from 2024.
GE Vernova set aside $760 million in warranty accruals in 2025, an 11% increase from 2024.
Generac set aside $101 million warranty accruals in 2025, a 29% increase from 2024. SolarEdge set aside $70 million in accruals, a 16% increase.
Enphase set aside $29 million in warranty accruals in 2025, a 6% increase. Fluence Energy set aside $25 million in accruals, a 38% increase. Valmont Industries set aside $24 million, a 6% increase. Bloom Energy set aside $21 million in accruals, a 16% increase.
Array Technologies set aside $17 million in warranty accruals in 2025, quadruple 2024's accruals of $4 million. First Solar set aside $17 million, more than double 2024's accruals of $7 million. SunPower set aside $3 million in accruals, triple 2024's accruals of $1 million. Eos Energy Enterprises set aside $3 million, quintuple 2024's accruals of $1 million.
Warranty Expense Rates
Figure 3 shows the average warranty claims and accrual rates for the U.S. power generation equipment industry, from 2003 to 2025.
Figure 3
Power Generation Equipment Warranties
Average Claims & Accrual Rates
(as a % of product sales, 2003-2025)
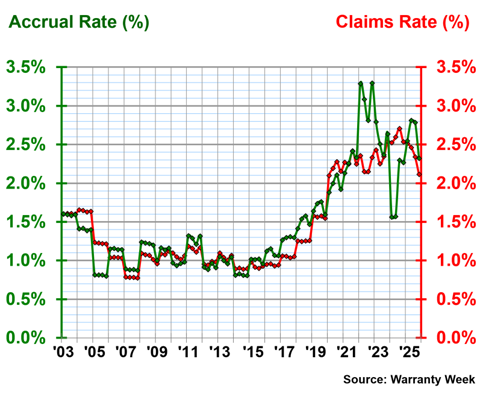
Over 23 years, the U.S.-based power generation equipment industry had an average warranty claims rate of 1.45%, with a standard deviation of 0.58%, and an average warranty accrual rate of 1.49%, with a standard deviation of 0.64%.
We can see in Figure 3 that the quarterly expense rates, especially the accrual rate, become more volatile and less predictable starting in 2022. This coincides with the beginning of our data from GE Vernova, rather than the parent General Electric. While GE Vernova publishes its warranty expenses on a quarterly basis, GE only did so on an annual basis, leading to the larger variation in warranty accrual rates from quarter to quarter.
In 2025, the industry had an average warranty claims rate of 2.36%. The quarterly averages ranged from 2.11% in the fourth quarter, to 2.43% in the first quarter.
In 2025, the industry had an average warranty accrual rate of 2.62%. The quarterly average accrual rates ranged from 2.32% in the fourth quarter, to 2.79% in the first quarter.
Warranty Reserve Balances
Figure 4 shows the total warranty reserves held by each U.S.-based power generation equipment manufacturer at the end of each year, from 2003 to 2025.
Figure 4
Power Generation Equipment Warranties
Reserves Held by U.S.-based Manufacturers
(in US$ millions, 2003-2025)
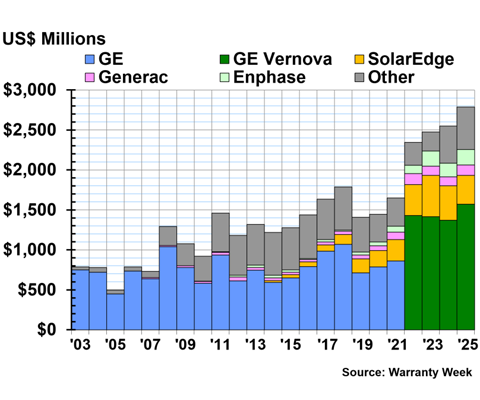
At the end of 2025, the U.S.-based power generation equipment manufacturers held $2.59 billion in warranty reserves, a 9% increase from the end of 2024.
GE Vernova held $1.57 billion in warranty reserves at the end of 2025, a 15% increase from the end of 2024.
SolarEdge held $358 million in warranty reserves at the end of 2025, a -17% decrease from the end of the year prior. Enphase Energy held $193 million in reserves at the end of 2025, a 13% increase. Generac held $132 million in reserves, a 19% increase.
First Solar held $79 million in reserves at the end of 2025, a 4% increase. Fluence Energy held $53 million in reserves, a 39% increase. TPI Composites held $46 million in reserves, an 18% increase. Microvast Holdings held $39 million in reserves, an 18% increase. Valmont Industries held $27 million in reserves, a 15% increase. Bloom Energy held $20 million, a 21% increase.
Array Technologies held $16 million in reserves at the end of 2025, a 137% increase from the end of 2024. Eos Energy Enterprises held $9.5 million in reserves, an 86% increase.
Check out the rest of our series of 23-year charts:
Vehicle Sector
- 23rd Annual Product Warranty Report
- U.S. Passenger Vehicle Warranty Expenses
- U.S. Truck & Bus Warranty Expenses
- U.S. Auto Parts & Powertrain Warranty Expenses
- U.S. Aerospace Warranty Expenses
Building Trades Sector
- U.S. New Home & Building Materials Warranty Expenses
- U.S. HVAC & Appliance Warranty Expenses Expenses