New Home Builder Warranty Expenses:
Total warranty claims paid, accruals made, and reserves held all decreased in 2025 for the U.S.-based new home builders. On average, the homebuilders set aside $2,739 per new home sold in 2025.
The average amount of warranty accruals set aside by U.S.-based homebuilders per new home sold decreased over the course of 2025. In the fourth quarter of 2025, the average accrual rate per home sold decreased to below the 10-year average for the first time since early 2021.
About half of U.S.-based homebuilders are publicly traded, and publish their warranty expenses in their annual reports and quarterly financial statements. These companies also publish data on the number of new homes sold, and the amount of homebuilding revenue they make (excluding mortgage-lending income and land sales, if any).
Thus, for a set of 23 homebuilders, we are able to calculate the amount of warranty accruals made per new home sold — similar to accruals per vehicle sold, which we calculate for the worldwide automakers.
As we will see in Figures 5-10, many of the homebuilders that were acquired (see Methodology section) had quite volatile and unpredictable warranty accruals per home sold before the change in ownership. In theory, homebuilders should expect to spend the same amount on warranty for every home sold. High degrees of variance from quarter to quarter can indicate issues with the actuarial formula, or perhaps a lack of attention to warranty costs, which can spiral out of control and affect profits.
Methodology
We gathered data from 23 U.S.-based homebuilders, all of which report their warranty expenses on a quarterly basis. Some of these homebuilders have changed hand over the years.
For each homebuilder, we perused their annual reports and quarterly financial statements, and gathered three key warranty metrics: the amount of claims paid, the amount of accruals made, and the end-balance of the warranty reserve fund. In addition, we gathered data on the amount of homebuilding revenue they reported, and the number of homes sold.
Using these data, we calculated three additional warranty ratios: claims as a percentage of sales revenue (the claims rate), accruals as a percentage of revenue (the accrual rate), and the dollar amount of warranty accruals set aside per home sold (total accruals / number of homes closed). This newsletter will focus on the latter calculation in Figures 4-10; we will explore the other calculations in upcoming newsletters.
The 15 homebuilders that reported warranty expenses in 2025 were: Beazer Homes USA Inc., Century Communities Inc., D.R. Horton Inc., Green Brick Partners, Hovnanian Enterprises Inc., KB Home, LGI Homes Inc., Lennar Corp., M/I Homes Inc., Meritage Homes Corp., NVR Inc., PulteGroup Inc., Sekisui House US Inc., Taylor Morrison Home Corp., and Toll Brothers Inc.
In addition, our charts include data from an additional eight homebuilders that reported warranty expenses in the past, but have since been acquired or gone private, and ceased reporting. These manufacturers are: AV Homes Inc., CalAtlantic Group Inc., Landsea Homes, M.D.C. Holdings Inc., New Home Co. Inc., Ryland Group Inc., Shea Homes LP, and William Lyon Homes.
Taylor Morrison acquired AV Homes and William Lyon in 2018. Standard Pacific and Ryland merged in 2015, forming CalAtlantic; then, in 2018, Lennar acquired CalAtlantic. New Home Co. was acquired by private equity firm Apollo Global Management in 2021. Shea Homes was acquired by a private investor in 2014.
More recently, in April 2024, Sekisui House US acquired M.D.C.. New Home Co., private since 2021, acquired Landsea Homes in June 2025.
We also gathered data from Dream Finders Homes Inc., but since the company only reports on an annual basis, we did not calculate accruals per home sold, since we track that metric on a quarterly basis. However, data from Dreams Finders are included in the totals in Figures 1-3.
Similarly, since the accrual rate per home sold is a central calculation to this newsletter, we did not include data from manufacturers of mobile homes, modular homes, or tiny houses. Furthermore, these data only include manufacturers that predominantly produce site-built homes, rather than pre-fabricated or manufactured homes. We will explore the warranty expenses of manufacturers in the broader housing field, also including makers of building materials, HVAC systems, and appliances, in upcoming newsletters.
Warranty Claims Totals
Figure 1 shows the total warranty claims paid by the 23 U.S.-based homebuilders over 10 years, from 2016 to 2025.
Figure 1
Homebuilding Warranties:
Claims Paid per Quarter by U.S.-based Builders
(in millions of U.S. dollars, 2016-2025)
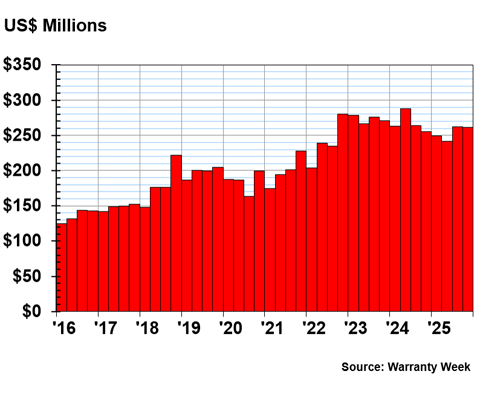
In calendar 2025, the public U.S.-based homebuilders paid $1.014 billion in warranty claims, a decrease of -5% from 2024.
The homebuilders paid $249 million in warranty claims in the first quarter of 2025, a decrease of -5% compared to the first quarter of 2024. They paid $241 million in claims in the second quarter of 2025, a year-over-year decrease of -16%. And they paid $262 million in the third quarter of 2025, a year-over-year decrease of -1%.
The homebuilders paid $262 million in warranty claims in the fourth quarter of 2025, an increase of 2% from the fourth quarter of 2024. The fourth was the only quarter of 2025 in which the homebuilders paid more in claims than they did in the same period of 2024.
Warranty Accrual Totals
Figure 2 shows the total amount of quarterly warranty accruals set aside by the homebuilders over 10 years, from 2016 to 2025.
Figure 2
Homebuilding Warranties:
Accruals Made per Quarter by U.S.-based Builders
(in millions of U.S. dollars, 2016-2025)
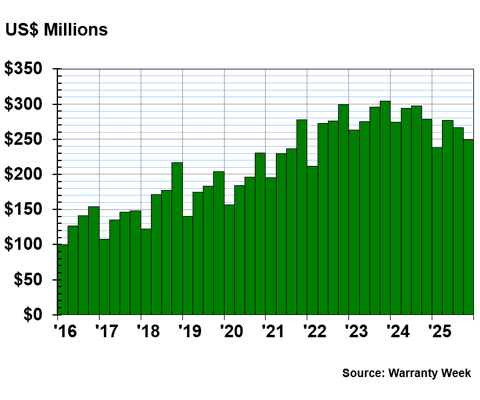
The new home builders set aside $1.031 billion in warranty accruals in 2025, a -10% decrease compared to 2024.
In the first quarter of 2025, the homebuilders set aside $238 million in warranty accruals, a -13% decrease compared to the first quarter of 2024. In the second quarter, they set aside $277 million in accruals, a year-over-year decrease of -6%. In the third quarter, they set aside $267 million, a year-over-year decrease of -10%. And in the fourth quarter, they set aside $249 million in accruals, a -11% decrease.
Warranty Reserve Balances
Figure 3 shows the quarterly end-balances of the warranty reserve funds held by the new home builders, from 2016 to 2025.
Figure 3
Homebuilding Warranties:
Reserves Held per Quarter by U.S.-based Builders
(in millions of U.S. dollars, 2016-2025)
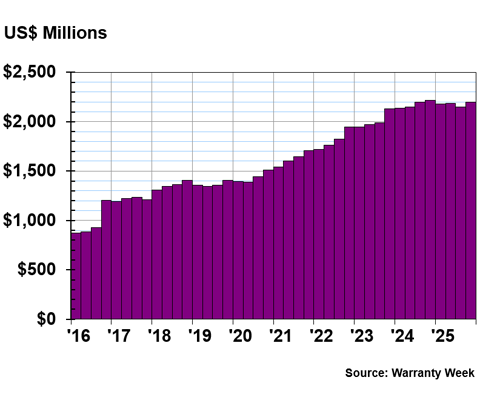
At the end of calendar 2025, the homebuilders held $2.196 billion in warranty reserves, a -1% decrease from the balance held at the end of 2024.
Accruals per Home Sold
Figure 4 shows the average accrual rate per home sold, across the new home builders, from 2016 to 2025.
Figure 4
Homebuilding Warranties:
Average Warranty Accruals Made per Unit Sold
(in U.S. dollars, 2016-2025)
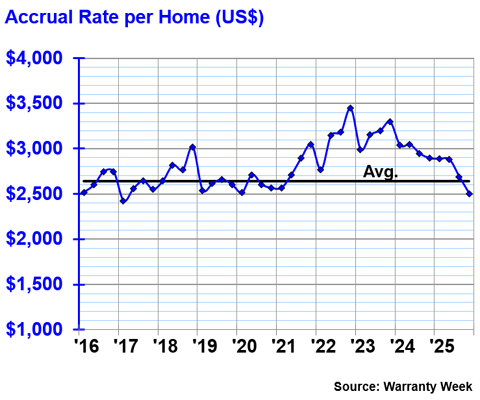
While we only show 10 years of data in Figure 4, we possess 23 years of data, from 2003 to 2025. Over 23 years, the homebuilders set aside an average of $2,643 for every new home sold.
Over the whole of 2025, the homebuilders set aside an average of $2,739 for every new home sold, above the 23-year average.
In the first quarter of 2025, the homebuilders set aside an average of $2,887 per new home sold; in the second quarter, an average of $2,880 per home sold; and in the third quarter, an average of $2,688 per home sold. In the fourth quarter of 2025, the average fell to $2,503 in warranty accruals set aside per new home sold. This was the first time since the first quarter of 2021 that this figure fell below that 23-year industry-wide average.
Accrual Rates for Specific Builders
Figures 5-10 show the average quarterly accruals made per home sold, for each of the 23 individual homebuilders that report their warranty expenses. These companies are grouped by the minimums and maximums of this rate, so pay attention to the differing y-axis scales in these charts. These charts each depict 23 years of data, from 2003 to 2025.
Figure 5 shows the companies with the largest maximums, thus the most volatile of the bunch in terms of the rate of warranty accruals per home sold. In contrast, Figure 10 has the smallest y-axis scale, and shows the homebuilders with the most predictable and steady warranty accrual behavior.
Figure 5
Homebuilding Warranties:
Warranty Accruals Made per Unit Sold
(in U.S. dollars, 2003-2025)
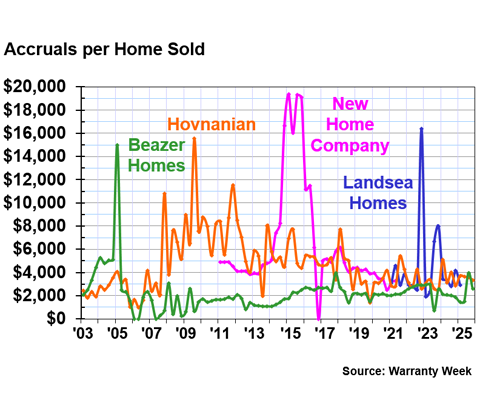
Beazer Homes and Hovnanian are good examples of homebuilders that were able to moderate their warranty expenses, after initial volatility. On the other hand, New Home Co. and Landsea Homes illustrate our point that highly volatile warranty accruals per home sold can be an indicator of trouble on the horizon, often resulting in acquisition.
Landsea was only sold in June 2025, but the signs are indicated in these data. Landsea is now a part of New Home Co., which itself was acquired by private equity in 2021.
In its final quarter of reporting, the first quarter of 2025, Landsea set aside an average of $2,900 per home sold. In the fourth quarter of 2024, Landsea set aside an average of $4,142 per home sold. At its maximum, Landsea set aside an average of $16,376 per home sold, in the fourth quarter of 2022. In the following quarter, the first quarter of 2023, Landsea set aside an average of $1,930 per home sold, a stark drop to the minimum we saw from the company.
Hovnanian experienced its maximum accruals per home sold during the recession in 2009, and this rate has flattened out especially since 2019. In the fourth quarter of 2025, Hovnanian set aside $3,347 per home sold. In the first quarter of 2025, the homebuilder set aside and average of $3,707 per home sold.
Over 23 years, Beezer Homes USA is an even better example of truly mastering a predictable formula for quarterly accruals per home sold. However, its rate was far more volatile than that of Hovnanian over the course of 2025. In the first quarter of 2025, Beezer Homes set aside an average of $1,438 per home sold. In the third quarter of 2025, Beezer set aside an average of $3,962 per home sold.
While Figure 5 has a larger y-axis scale, we see a larger degree of recent volatility in this rate from two major homebuilders in Figure 6.
Figure 6
Homebuilding Warranties:
Warranty Accruals Made per Unit Sold
(in U.S. dollars, 2003-2025)
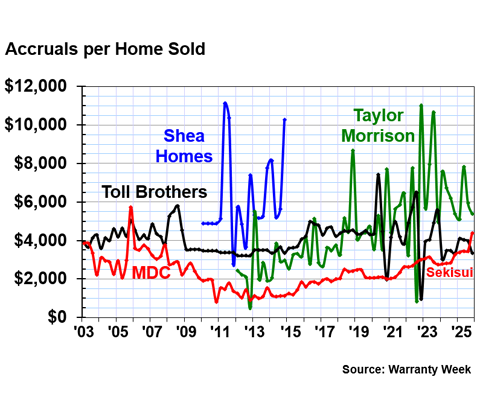
Taylor Morrison is a homebuilder that sees a very high degree of volatility in its average warranty accruals per home sold. We've seen especially oscillating rates from Taylor Morrison since it acquired two other homebuilders, AV Homes and William Lyon, in 2018.
At the high for the year, in the second quarter of 2025, Taylor Morrison set aside an average of $7,826 per home sold. At the low, Taylor Morrison set aside an average of $5,109 per home sold in the first quarter of 2025. These figures are quite high for the industry — again, the average across all of the homebuilders for 2025 was $2,739 set aside per home sold.
Toll Brothers has seen a larger degree of volatility in this metric since 2019, but 2025 was relatively moderate. At the high, in the first quarter of 2025, Toll Brothers set aside an average of $4,089 per home sold. At the low, in the fourth quarter of 2025, Toll Brothers set aside and average of $3,332 per home sold.
Shea Homes was acquired and went private in 2014, again showing the importance of predictability in this metric.
M.D.C. Holdings was acquired by the U.S. branch of the Japanese homebuilder Sekisui in mid-2024. However, the subsidiary Sekisui House US Holdings has continued to report its warranty expenses. In the first quarter of 2025, Sekisui US set aside an average of $3,376 per home sold. In the fourth quarter of 2025, Sekisui set aside an average of $4,388 per home sold.
Figure 7 has a slightly smaller y-axis scale than Figure 6 does.
Figure 7
Homebuilding Warranties:
Warranty Accruals Made per Unit Sold
(in U.S. dollars, 2003-2025)
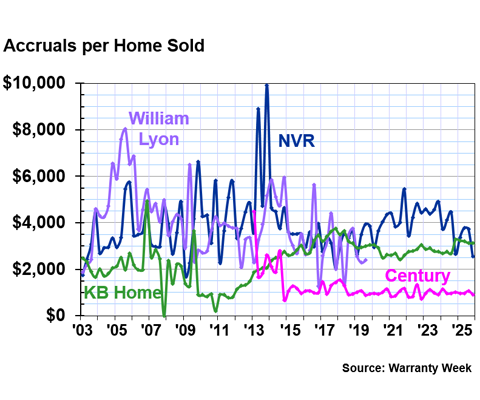
William Lyon was acquired by Taylor Morrison (see Figure 6) in 2018.
In 2025, NVR's average accruals per home sold ranged from $2,546 in the fourth quarter, to $3,774 in the second quarter. KB Home's average accruals per home sold ranged from $3,128 in the fourth quarter, to $3,239 in the first quarter. And Century Communities' average accruals per home sold ranged from $909 per home sold in the fourth quarter, to $1,055 per home sold in the third quarter.
Figure 8 is essentially the family tree of one company, Lennar Corp., which has acquired the other three companies depicted in the chart. Note that the y-axis scale is cut in half from Figure 7 to Figure 8; it's safe to say that the homebuilders in Figures 8-10 have been the most stable and consistent in warranty accruals per home sold, since 2003.
Figure 8
Homebuilding Warranties:
Warranty Accruals Made per Unit Sold
(in U.S. dollars, 2003-2025)
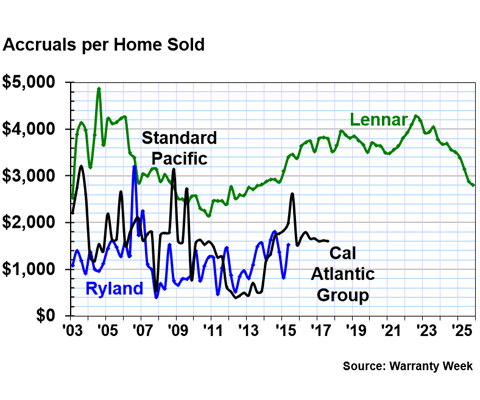
Standard Pacific Homes and Ryland Group merged in 2015, and changed their name to CalAtlantic Group. In 2018, Lennar acquired CalAtlantic.
Lennar is one of the largest publicly traded homebuilders in the United States, and one of the top three manufacturers in this warranty report. It joins D.R. Horton (see Figure 10) and PulteGroup (see Figure 9) at the top, whether you measure size based on the number of homes built, number of homes sold, or total housing revenue. Based on the thesis we've posited in this report, that warranty expenses per home sold should remain relatively stable from quarter to quarter, it is not surprising that the three largest homebuilders are all very consistent in this metric.
Lennar especially stands out in contrast to Taylor Morrison, where the acquisition of William Lyon and AV Homes caused Taylor Morrison's accruals per home sold to become more volatile. Since Lennar's acquisition of CalAtlantic, it has successfully smoothed out CalAtlantic's formerly inconsistent accruals per home sold.
In 2025, Lennar's average warranty accruals per home sold ranged from $2,808 in the fourth quarter, to $3,391 in the first quarter. Lennar's average accruals per home sold have continued to drop since 2022, and have decreased every quarter since the second quarter of 2024.
Figure 9 is on the same y-axis scale as Figure 8. It includes three legacy companies, along with newcomer Green Brick.
Figure 9
Homebuilding Warranties:
Warranty Accruals Made per Unit Sold
(in U.S. dollars, 2003-2025)
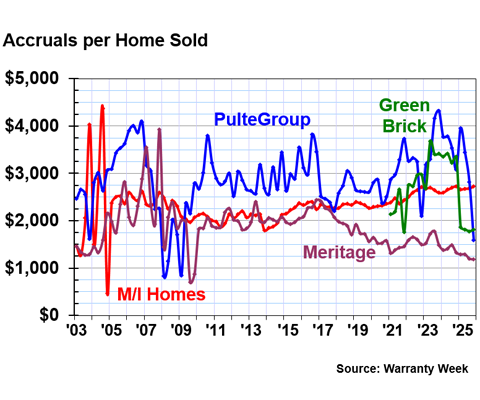
In 2025, PulteGroup's average quarterly accruals per home sold ranged from $1,587 in the fourth quarter, to $3,952 in the first quarter. That's a wider range than we've seen from other homebuilders in the later figures of this report, but still smoother than the homebuilders in the first few charts. Still, it's a very steep drop in this metric from the first to the fourth quarter of 2025.
Green Brick's average quarterly accruals per home sold ranged from $1,769 in the third quarter of 2025, to $1,858 in the first quarter.
Meritage's average accruals per home sold ranged from $1,180 in the fourth quarter, to $1,285 in the first quarter.
Of this grouping of four, M/I Homes has been the most stable in this metric since the Great Recession. In 2025, M/I's average accruals per home sold ranged from $2,663 in the first quarter, to $2,731 in the fourth quarter.
Finally, Figure 10 has a slightly smaller y-axis scale, and shows three more homebuilders.
Figure 10
Homebuilding Warranties:
Warranty Accruals Made per Unit Sold
(in U.S. dollars, 2003-2025)
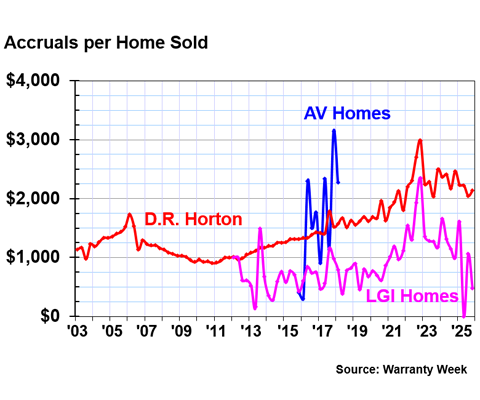
As we mentioned, AV Homes was acquired by Taylor Morrison (see Figure 6) in 2018.
D.R. Horton has seen a slightly greater degree of volatility in this metric in recent years, but is still quite consistent, relatively speaking, in its average warranty accruals per home sold. In 2025, D.R. Horton's average accruals per home sold ranged from $2,137 in the fourth quarter, to $2,231 in the first quarter.
LGI Homes strangely did not report any warranty accruals in the second quarter of 2025, causing that large dip in the data. Excluding that $0 in the second quarter, LGI's average warranty accruals per home sold ranged from $473 in the fourth quarter, to $1,600 in the first quarter.