Worldwide Auto Warranty Report:
From 2023 to 2024, the total amount the global auto OEMs paid in warranty claims increased by 18%, the total amount set aside in warranty accruals increased by 11%, and the total amount held in warranty reserves increased by 10%. The industry average warranty claims and accrual rates increased as well.
Rising parts and labor costs, labor shortages, inflation, and currency devaluations drove up warranty costs for almost every global automotive OEM in 2024. This was the second year in a row where we saw new record high totals for all three warranty metrics.
Keep in mind that U.S. tariffs don't come into play in these data, since they were implemented in 2025. However, we expect global warranty costs to continue to rise due to these factors. In addition, global currency fluctuations and devaluations against the U.S. dollar, the currency we use for this newsletter, have impacted both the actual cost of warranty work, and the cost on paper when converted into USD.
The global automotive industry is unique in its warranty accounting norms. The U.S. SEC requires all manufacturers to report how much they pay in warranty claims and accruals, and hold in warranty reserves; however, outside of the U.S., reporting these data is largely voluntary on the part of each OEM. Lucky for us, reporting these data are the norm among the global auto OEMs.
We track the warranty expenses of 35 major automotive manufacturers around the world, which report some or all of their warranty metrics to their investors in their annual reports.
Most report the amount they pay in claims, the amount of accruals they make, and the end-balance of the warranty reserve fund. Some report only the amount they hold in warranty reserves at the end of each fiscal year. A few report their reserve balance, along with the amount of warranty accruals they make. For those partial reporters, we fashion estimates for the missing data.
We also fashioned estimates for five more auto OEMs that do not report their warranty expenses at all. That makes a total of 40 global auto OEMs represented in this report. These data represent about 95% of all global warranty expenses for passenger vehicles.
Methodology
For each OEM, we perused their annual reports, and gathered three key warranty metrics: the amount of product warranty claims paid, the amount of warranty accruals made, and the end-balance of the warranty reserve fund. In addition, we recorded two sales metrics: the amount of vehicle sales revenue, and the unit number of vehicles sold.
We used these data to calculate our three warranty expense rates: claims as a percent of vehicle sales revenue (the claims rate), accruals as a percent of vehicle sales (the accrual rate), and accruals per vehicle unit sold (in U.S. dollars).
In order to standardize our data for ease of comparison, we first gathered all data in native currencies, and then converted these figures into U.S. dollars using the exchange rates from the U.S. IRS Yearly average currency exchange rates table. Take a look at the footnote to this article to find links to reports on warranty expenses in international auto markets in their native currencies.
We gathered data from 35 passenger car and light truck OEMs from several global markets. Of course, many of these companies also manufacture heavy trucks, motorcycles, tractors, generators, etc.; however, cars are their primary product line. Because of these nuances, we will refrain from comparing individual companies to each other; instead, we will look at the global auto industry as a whole, and compare individual OEMs to their own past.
From the United States, we collected data from Ford Motor Co., General Motors Co., and Tesla Inc.
While we also collect data from U.S.-based EV OEMs Rivian and Lucid, they do not produce vehicles — or pay warranty claims — on a scale to show up in our charts. Take a look at our recent newsletter "U.S. Electric Vehicle Warranties" for details on the warranty expenses of these two EV companies.
From Europe, we gathered data from Volkswagen AG, Stellantis N.V., Mercedes-Benz Group AG, Bayerische Motoren Werke (BMW) AG, Renault S.A., Volvo Car AB, Polestar Automotive Holding UK PLC, and Ferrari S.p.A. Seven of the eight report in Euro, while Polestar reports in U.S. dollars, despite being based in Sweden.
Polestar, a luxury EV manufacturer, is a subsidiary of Volvo Cars, which in turn is majority-owned by the China-based Geely Holding Group, also the parent company of Geely Auto. Polestar and Volvo Cars both file their own separate, independent annual reports that do include warranty data, while Geely Auto doesn't report any of its warranty expenses.
From India, and reporting in rupees using the Indian numbering system, we have data from Tata Motors Ltd. and Mahindra & Mahindra Ltd. Tata is the parent company of the UK-based Jaguar Land Rover (JLR).
Unlike the relationship between Volvo Cars, Polestar, and Geely, Jaguar Land Rover does not file a separate annual report from Tata. However, we were able to calculate JLR's warranty expense rates based on segmented data.
From Japan and reporting in Japanese yen, we have Toyota Motor Corp., Honda Motor Co. Ltd., Subaru Corp., and Mitsubishi Motors Corp. as full reporters of all three warranty metrics.
In addition, we have partial data from Nissan Motor Co. Ltd., Mazda Motor Corp., Isuzu Motors Ltd., and Hino Motors Ltd. These four manufacturers reported the end-balance of the warranty reserve fund, and the amount of warranty accruals made, but not the amount of claims paid. Since they gave us two of the three figures, we solved for x. While we're quite confident in these calculations, they are classed as estimates.
The Japanese and Indian manufacturers all use a fiscal year that ends on March 31, three months later than their global peers. We do not time-shift these data. For instance, the data from the fiscal year that spanned April 1, 2024 to March 31, 2025 are counted in the 2024 worldwide totals.
From South Korea, we have data from Hyundai Motor Co. and Kia Motors Corp., both of which report in South Korean won.
From Vietnam and reporting in Vietnamese dong, we have newcomer VinFast Auto Ltd. VinFast makes electric vehicles, both cars and scooters, and is a subsidiary of Vietnamese conglomerate Vingroup JSC.
Finally, from China, we now have ten OEMs reporting their warranty expenses in Chinese yuan.
Six of the ten OEMs reported all three warranty metrics: BAIC Motor Corp. Ltd., Chang'an Automobile Co. Ltd., Guangzhou Automobile (GAC) Group Co. Ltd., Li Auto Inc., Nio Inc., and XPeng Inc.
Nio, Li Auto, and XPeng are all EV-only manufacturers, along with BEV and PHEV manufacturer BYD.
BYD Company Ltd. and SAIC Motor Corp. Ltd. reported their total warranty accruals, and the end-balance of the warranty reserve fund, but did not report the amount they paid in warranty claims.
In addition Great Wall Motor Co. Ltd. and Dongfeng Motor Corp. both reported the amount of accruals made, but not the amount of claims paid or the end-balance of the reserve fund.
And then there were five more OEMs for which we fashioned estimates, based on industry averages and previous vehicle revenue data. From Japan, we calculated estimates for Suzuki Motor Corp., and from China, we created estimates for Chery Automobile Co. Ltd., China First Automobile Works (FAW) Group Corp. Ltd., Geely Automobile Holdings Ltd., and Anhui Jianghuai Automobile (JAC) Group Corp. Ltd.
China is the global market in which our data have the most gaps. However, as we will see in the following charts, especially Figure 5d, product warranty expenses tend to be much lower in China, due to differing cultural and industrial norms around vehicle warranty work.
We've found that the warranty expenses of Chinese OEMs increase once they being exporting around the world, so we expect that this aspect of our data will grow in coming years. However, especially with the government-owned Chinese automakers, there is a certain opacity to warranty data, due to a lack of regulatory requirement to report these figures.
While the estimates are factored into our overall totals, we refrain from detailing these estimates in the following charts.
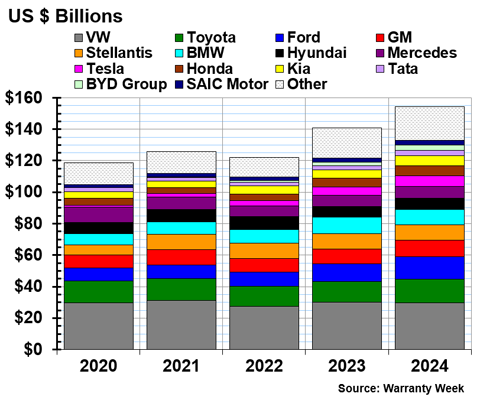
Warranty Claims Totals
In 2024, the global passenger car OEMs paid a total of $57.9 billion in warranty claims.
Figure 1 shows the amount of warranty claims paid by the largest global auto OEMs, from 2020 to 2024.
Figure 1
Worldwide Auto Manufacturers
Claims Paid per Year
(in millions of U.S. dollars, 2020-2024)
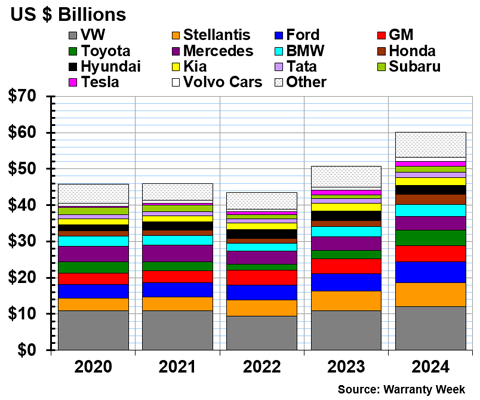
First, we'll do the faster job of telling you which few OEMs saw their warranty claims costs decrease from 2023 to 2024.
Hyundai paid $2.50 billion in claims in 2024, a -5% decrease from 2023. Kia paid $2.08 billion, a -8% decrease. Both of these South Korean automakers saw claims costs decrease in 2024 after higher-than-usual costs in 2023 associated with two large recalls, one for Theta 2 engines, and one for Anti-Lock Braking Systems.
Renault paid $641 million in claims in 2024, a -16% decrease from 2023. Polestar paid $42 million, a -8% decrease.
From China, BAIC paid $369 million in claims, a -13% decrease. Changan paid $134 million in claims in 2024, a -11% decrease. And XPeng paid $31 million, a -4% decrease.
Now, let's look at the largest increases in claims costs from 2023 to 2024. Vietnamese EV OEM VinFast paid $40 million in claims in 2024, a 158% increase from 2023's total of $16 million. Chinese EV OEM Li Auto paid $43 million in claims, a 128% increase.
Toyota paid $4.18 billion in claims in 2024, a 72% increase. Honda paid $2.72 billion, a 73% increase. Subaru paid $1.52 billion, a 50% increase. Keep in mind that the devaluation of the Japanese yen affected the changes in these data.
Volkswagen paid $12.02 billion in warranty claims in 2024, an 11% increase from 2023. Stellantis paid $6.53 billion in claims, a 19% increase. Ford paid $5.83 billion in warranty claims, a 22% increase. GM paid $4.47 billion in claims, a 11% increase from the year prior.
Warranty Claims Rates
In 2024, the global auto OEMs had an average warranty claims rate of 2.2%, up by about one-sixth from 1.9% in 2023.
Figure 2 shows each OEM's warranty claims rate in 2023 and 2024. We calculate these percentages by dividing the amount of claims paid by the amount of vehicle sales revenue generated in a fiscal year.
Figure 2
Worldwide Auto Manufacturers
Average Warranty Claims Rates
(as a percentage of sales, 2023 & 2024)
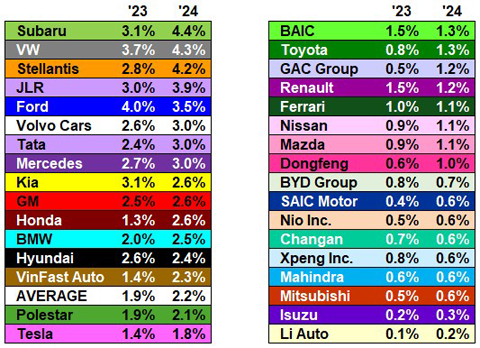
Honda's warranty claims rate doubled, from 1.3% in 2023, to 2.6% in 2024.
GAC Group saw its claims rate more than double, from 0.5% in 2023, to 1.2% in 2024. Li Auto's claims rate also doubled, from 0.1% in 2023, to 0.2% in 2024.
Stellantis' claims rate increased by half, from 2.8% in 2023, to 4.2% in 2024. VinFast's claims rate increased by a similar degree, from 1.4% in 2023, to 2.3% in 2024. Toyota's claims rate increased from 0.8% to 1.3%. And Dongfeng's claims rate increased from 0.6% to 1.0%.
Only a few OEMs saw their claims rates decrease from 2023 to 2024. Ford's claims rate decreased slightly, from 4.0% in 2023 to 3.5% in 2024. Kia's claims rate decreased from 3.1% to 2.6%. Hyundai's claims rate decreased from 2.6% to 2.4%. In addition, Renault, BAIC, Changan, BYD, and XPeng saw their claims rates decrease slightly from 2023 to 2024.
Warranty Accrual Totals
In 2024, the global automakers set aside a total of $72.5 billion in warranty accruals, an 11% increase from 2023.
Figure 3 shows the total warranty accruals of the top global automakers, from fiscal year 2020 to 2024.
Figure 3
Worldwide Auto Manufacturers
Accruals Made per Year
(in millions of U.S. dollars, 2020-2024)
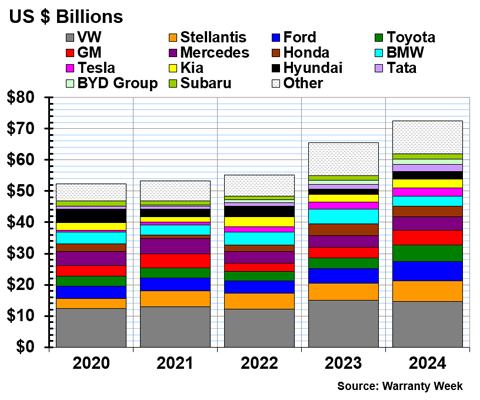
11 automakers decreased their warranty accruals from 2023 to 2024, and 24 increased their accruals.
BMW set aside $3.16 billion in warranty accruals in 2024, a -31% decrease from 2023. Honda set aside $3.46 billion in accruals, a -9% decrease.
Nissan and Volkswagen both slightly decreased their accruals. VW set aside $14.58 billion in accruals in 2024, a -3% decrease. Nissan accrued $993 million, a -5% decrease.
Polestar set aside $72 million in warranty accruals in 2024, a -23% decrease. Hino Motors set aside $242 million, a -26% decrease. Renault set aside $616 million, a -21% decrease.
Two Chinese automakers also decreased their accruals. Changan set aside $347 million in accruals, a -15% decrease. BAIC set aside $411 million, a -13% decrease.
On the other side of the coin, VinFast more than doubled its warranty accruals, from $78 million in 2023, to $167 million in 2024.
GAC Group set aside $273 million in accruals in 2024, a 66% increase from 2023. Hyundai set aside $2.60 billion, a 56% increase. Toyota set aside $5.25 billion in accruals, a 50% increase. Tata set aside $2.15 billion, a 47% increase.
A few Chinese automakers increased their total warranty accruals in 2024. BYD set aside $1.84 billion in warranty accruals, a 32% increase. Great Wall set aside $143 million, a 46% increase. And Dongfeng set aside $130 million, a 42% increase.
GM set aside $4.62 billion in warranty accruals, a 41% increase. Ford set aside $6.29 billion, a 33% increase. Tesla set aside $2.73 billion, a 17% increase.
Ferrari set aside $97 million in accruals, a 42% increase. Volvo Cars set aside $1.40 billion, a 29% increase. Stellantis set aside $6.66 billion in accruals, a 21% increase.
Warranty Accrual Rates
The average warranty accrual rate in 2024 was 2.7%, up by about one-tenth from 2.5% in 2023.
Figure 4 shows the warranty accrual rates of the global automakers, in 2023 and 2024.
Figure 4
Worldwide Auto Manufacturers
Average Warranty Accrual Rates
(as a percentage of sales, 2023 & 2024)
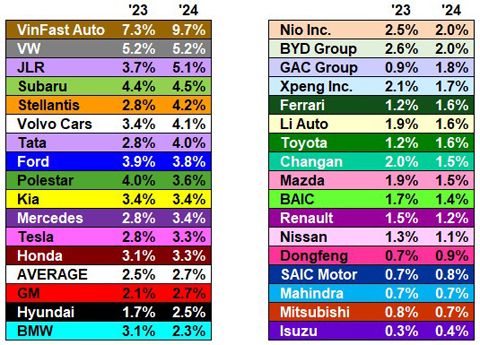
GAC Group's accrual rate doubled, from 0.9% in 2023 to 1.8% in 2024.
Stellantis increased its accrual rate by about one-half, from 2.8% in 2023 to 4.2% in 2024. Hyundai increased the accrual rate from 1.7% in 2023 to 2.5% in 2024. Tata's accrual rate increased from 2.8% in 2023 to 4.0% in 2024.
VinFast's accrual rate increased by about one-third, from 7.3% in 2023 to 9.7% in 2024. GM increased its accrual rate from 2.1% to 2.7%. Toyota increased its accrual rate from 1.2% to 1.6%.
BMW decreased its accrual rate by about one-quarter, from 3.1% to 2.3%. BYD decreased its accrual rate from 2.6% in 2023 to 2.0% in 2024. Changan decreased its accrual rate from 2.0% to 1.5%. XPeng decreased its accrual rate from 2.1% to 1.7%.
Accruals per Vehicle Sold
Our next warranty metric is the amount of accruals set aside per vehicle sold. We calculate this metric for each OEM by dividing the total amount of warranty accruals by the total unit number of vehicles sold.
The following three charts, Figures 5a-5c, are grouped based on range. The OEMs in Figure 5a set aside between $1,400 and $7,100 per vehicle sold; the OEMs in Figure 5b set aside between $445 and $1,300 per vehicle sold; and the OEMs in Figure 5c set aside between $50 and $440 per vehicle sold.
Figure 5a
Worldwide Auto Manufacturers
Accruals Made per Vehicle Sold
(in U.S. dollars, 2023 & 2024)
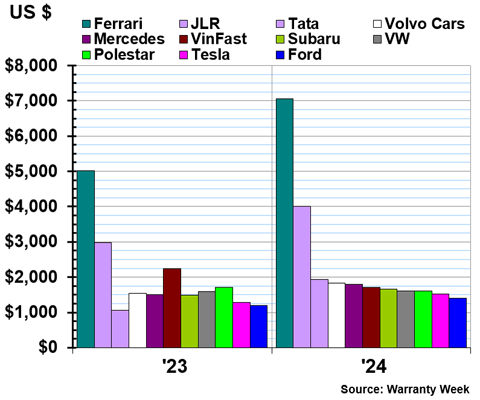
Many of the OEMs in Figure 5a make luxury vehicles with high prices, so it's not surprising that more funds would be set aside for repairs. Ferrari always tops this list, but its accruals per vehicle sold increased by 40% to $7,061 in 2024.
Tata's average accruals per vehicle sold increased by 80% to $1,932 in 2024. We can see that increases from its subsidiary Jaguar Land Rover drove this change.
VinFast's accruals per vehicle sold decreased by -20% to $1,716 in 2024. Polestar's accruals per vehicle decreased by -7% to $1,601.
Figure 5b
Worldwide Auto Manufacturers
Accruals Made per Vehicle Sold
(in U.S. dollars, 2023 & 2024)
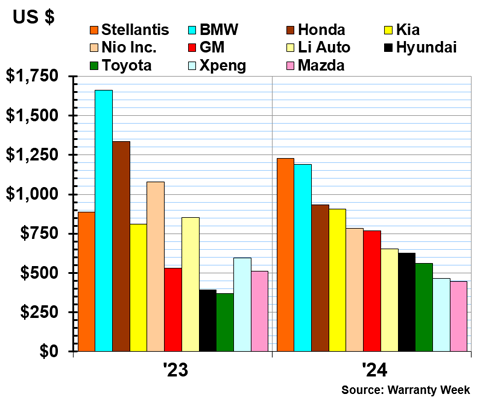
BMW's accruals per vehicle sold decreased by -30% to $1,188 in 2024. Honda's accruals per vehicle also decreased by -30%, to $932.
Nio's accruals per vehicle decreased by -30% to $782. Li Auto's accruals per vehicle decreased by -20% to $653. XPeng's accruals per vehicle decreased by -20% to $467.
Stellantis' accruals per vehicle increased by 40% to $1,230 in 2024. GM's accruals per vehicle increased by 45% to $770. Hyundai's accruals per vehicle sold increased by 60% to $628. And Toyota's accruals per vehicle increased by 50% to $561.
Figure 5c
Worldwide Auto Manufacturers
Accruals Made per Vehicle Sold
(in U.S. dollars, 2023 & 2024)
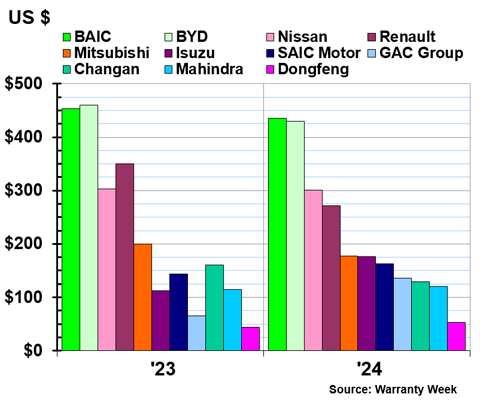
Half of the OEMs in this chart are based in China, where warranty expenses tend to be lower. BAIC and BYD both set aside about $430 per vehicle sold. At the far end of the spectrum, Dongfeng set aside just $53 per vehicle sold.
Isuzu set aside $176 in accruals per vehicle sold, a 60% increase from the year prior. GAC set aside $136 per vehicle sold, double 2023's average of $66 per vehicle sold.
Worldwide Average Warranty Expense Rates
Over 10 years, the average warranty claims rate among the global auto OEMs was 2.3%, and the average warranty accrual rate was 2.7%.
The combined 10-year average of the two rates was 2.5%. As a general rule of thumb, the global auto OEMs spend about 2.5% of vehicle revenue on warranty expenses.
Figure 6
Worldwide Auto Manufacturers
Average Claims & Accrual Rates
(as a percentage of sales, 2020-2024)
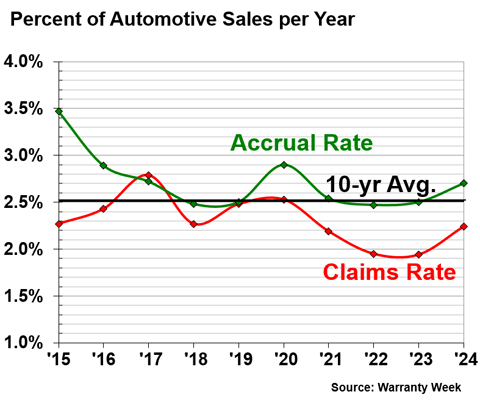
The industry average claims and accrual rates both increased from 2023 to 2024. Up until 2024, the average warranty expense rates were decreasing from 2020 to 2023.
Warranty Reserve Balances
Our final warranty metric is the end-balance of each automaker's warranty reserve fund. At the end of fiscal 2024, the global automakers held $154.19 billion in warranty reserves, an increase of 10% from the end of the year prior.
Figure 7 shows the automakers' warranty reserve end-balances, from 2020 to 2024.
Figure 7
Worldwide Auto Manufacturers
Reserves Held at Year's End
(in millions of U.S. dollars, 2020-2024)
Only five global automakers decreased the balance of their warranty reserve fund from 2023 to 2024. Dongfeng held $292 million in reserves at the end of 2024, a decrease of -30%. Polestar held $129 million in reserves at the end of 2024, a -12% decrease.
BMW held $9.75 billion in warranty reserves at the end of 2024, a -7% decrease. Renault held $906 million in reserves, a -6% decrease. Volkswagen slightly decreased the size of its warranty reserve fund as well, to $29.84 billion, a -1% decrease.
VinFast doubled the size of its warranty reserve fund, to $231 million at the end of 2024. Li Auto held $767 million in reserves, a 67% increase. BYD held $3.38 billion in reserves, a 64% increase. GAC held $305 million in reserves, a 47% increase.
Tesla held $6.72 billion in warranty reserves, a 30% increase. Ford held $14.03 billion, a 22% increase. Kia held $6.40 billion, a 20% increase. Toyota held $14.95 billion in reserves, a 14% increase. GM held $10.57 billion, a 14% increase. And Honda held $6.53 billion, a 13% increase.
Check out our region-specific newsletters depicting the 2024 international auto warranty expenses in native currencies, as well as the 2025 Q1 & Q2 American auto warranty expenses:
- "U.S. Auto Warranty Annual Reports"
- "European Automaker Warranty Expenses"
- "Japanese Automaker Warranty Expenses"
- "Mid-Year U.S. Auto Warranty Expenses"
- "Korean & Indian Automaker Warranty Expenses"
- "Chinese Electric Vehicle Warranties"
- "U.S. Electric Vehicle Warranties"